Fig. 7.
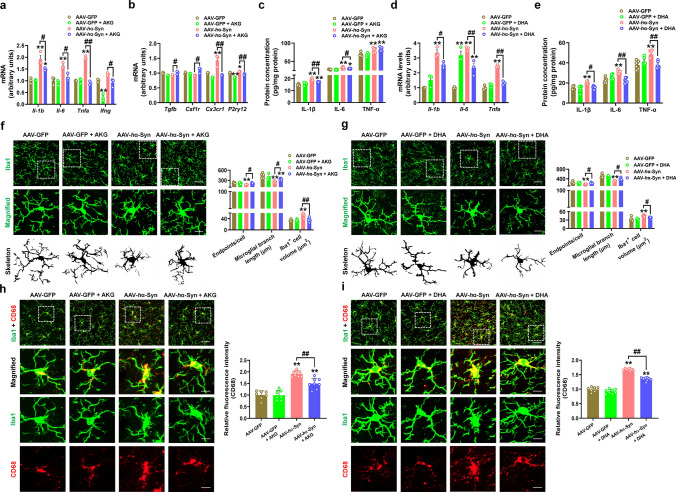
AKG and DHA suppress pro-inflammatory response in AAV-hα-Syn mice. a and b The mRNA expression levels of Il-1b, Il-6, Tnfa, Ifng, Tgfb, Csf1r, Cx3cr1, and P2ry12 in the AAV-GFP, AAV-GFP + AKG, AAV-hα-Syn, and AAV-hα-Syn + AKG groups. n = 3 per group. c The protein expression of IL-1β, IL-6, and TNF-α in the SN were determined by ELISA. n = 6 per group. d The mRNA expression levels of Il-1b, Il-6, and Tnfa in the AAV-GFP, AAV-GFP + DHA, AAV-hα-Syn, and AAV-hα-Syn + DHA groups. n = 3 per group. e The protein expression of IL-1β, IL-6, and TNF-α in the SN were determined by ELISA. n = 6 per group. f Immunofluorescence staining and quantification of endpoint voxels, branch length, and volume of Iba1-positive cells in the SN of AAV-GFP, AAV-GFP + AKG, AAV-hα-Syn, and AAV-hα-Syn + AKG groups. Scale bars, 40 μm. Magnified images are shown in the bottom row. Scale bars, 10 μm. n = 6–7. g Immunofluorescence staining and quantification of endpoint voxels, branch length, and volume of Iba1-positive cells in the SN of AAV-GFP, AAV-GFP + DHA, AAV-hα-Syn, and AAV-hα-Syn + DHA groups. Scale bars, 40 μm. Magnified images are shown in the bottom row. Scale bars, 10 μm. n = 6 per group. h Immunofluorescence staining and quantification of CD68 in the SN of AAV-GFP, AAV-GFP + AKG, AAV-hα-Syn, and AAV-hα-Syn + AKG groups. Scale bars, 40 μm. Magnified images are shown in the bottom row. Scale bars, 10 μm. n = 7–8. i Immunofluorescence staining and quantification of CD68 in the SN of AAV-GFP, AAV-GFP + DHA, AAV-hα-Syn, and AAV-hα-Syn + DHA groups. Scale bars, 40 μm. Magnified images are shown in the bottom row. Scale bars, 10 μm. n = 7–8. Results are expressed as the mean ± SEM. **p < 0.01, *p < 0.05 vs. AAV-GFP; ##p < 0.01, #p < 0.05 vs. AAV-hα-Syn. Statistical significance was determined using one-way ANOVA and Tukey’s test for post hoc comparisons

