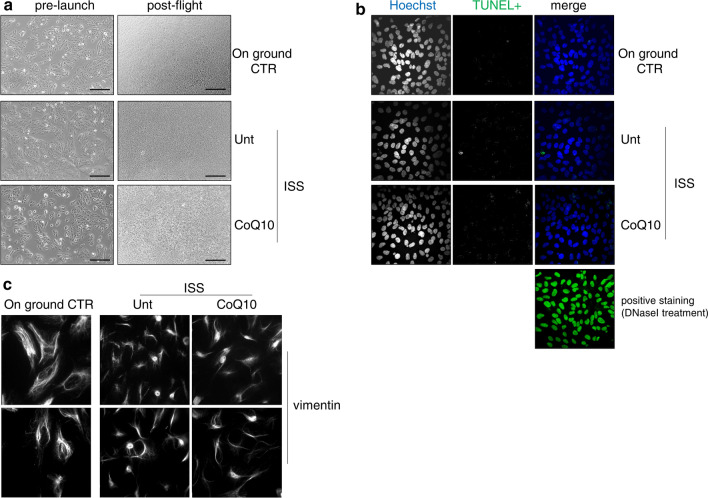
Fig. 2.
A Representative photomicrographs obtained with phase-contrast microscopy in ARPE-19 cells pre-launch and post-flight. Scale bar: 200 μm. B Evaluation of apoptosis in ARPE-19 cells by TUNEL fluorescent staining. Image size: 250 × 250 µm. C Evaluation of vimentin cellular localization in ARPE-19 cells by immunofluorescence. Image size: 100 × 100 µm

