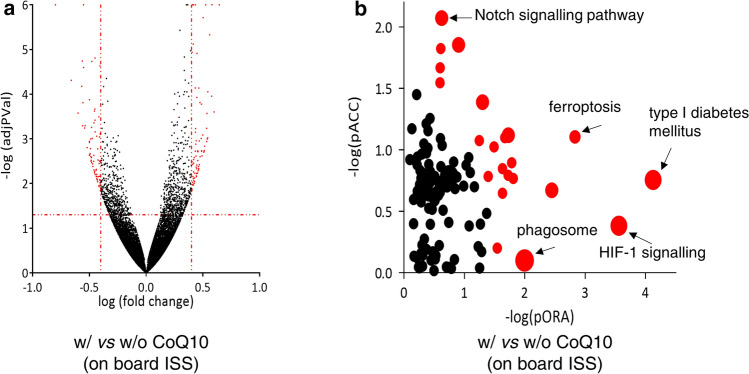
Fig. 6.
Gene expression analysis of ARPE-19 cells cultured on board the International Space Station in the presence of absence of coenzyme Q10. A All 153 significantly differentially expressed (DE) genes (showed in red) are represented in the Volcano plot in terms of their measured expression change (x-axis) and the significance of the change (y-axis), as in Fig. 3A. The dotted lines represent the thresholds used to select the DE genes: 0.4 for expression change and 0.05 for significance. B Pathway perturbation vs over-representation. Each pathway is represented by a single dot, with significant pathways shown in red, non-significant in black, and the size of each dot is proportional to the size of the pathway it represents. Both p values are shown in terms of their negative log (base 10) values

