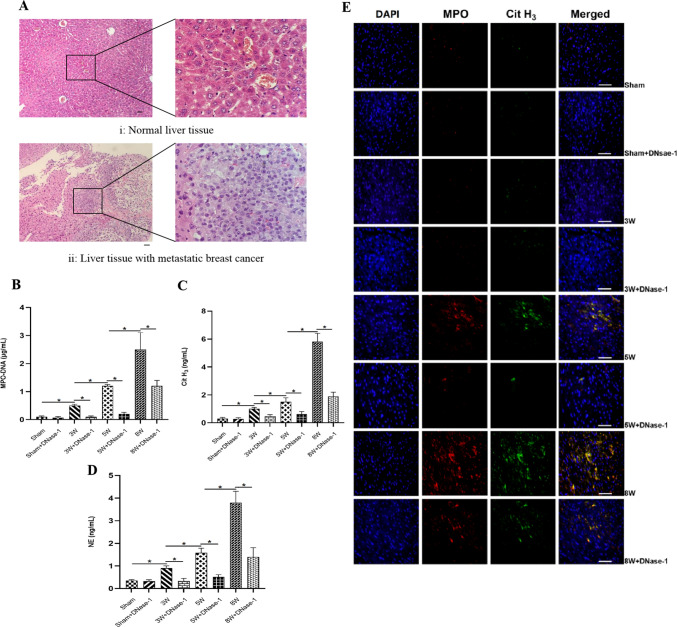
Fig. 1.
Comparison of NETs in nude mouse of TNBC cells liver metastatic. The group of Sham + DNase-1, 3W + DNase-1, 5W + DNase-1, 8W + DNase-1 were intraperitoneal injected of DNase-1 (15 U/g) daily at the beginning, after injected MDA-MB-231 BC cells. A Normal liver tissue and liver tissue with metastatic BC by HE Staining (Scale bar, 50 μm). B–D The levels of NETs specific markers (MPO − DNA complex, Cit H3, NE) in serum of nude mice by ELISA. E The distribution of NETs in nude mice cardiac tissue by Tissular Immunofluorescence Staining (Scale bar, 50 μm). *P < 0.05. (n = 5)

