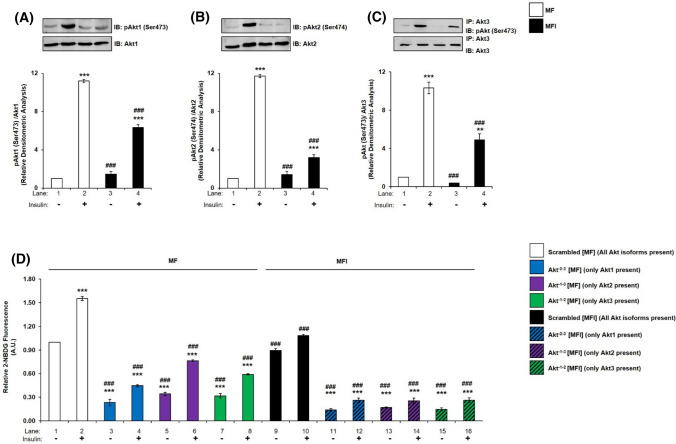
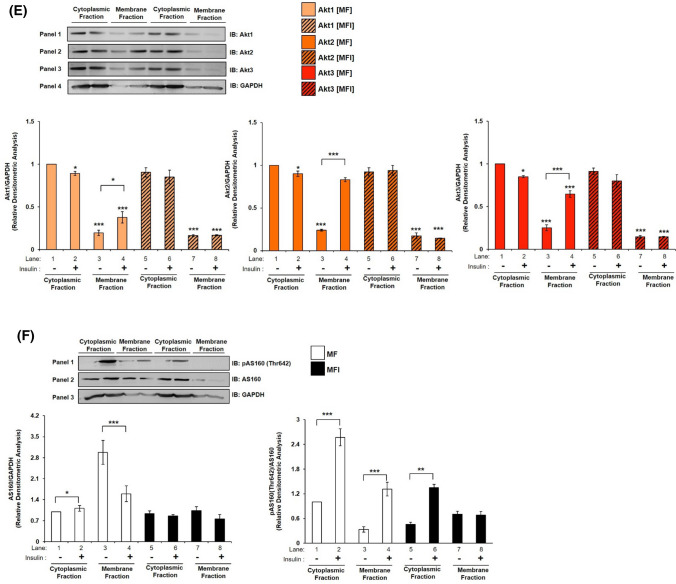
Fig. 8.
Expression and activation of Akt1, Akt2, and Akt3, glucose uptake and subcellular translocation under insulin-resistant condition in neuronal cells. (A–C) N2A cells were differentiated in serum-free medium in the absence of (MF) or chronic presence of 100 nM insulin (MFI) for 3 days. Cells were lysed and subjected to western blotting, followed by probing with relevant primary antibodies. Bar represents relative change when probed with anti-Akt isoform specific antibody. A Bar represents relative change in pAkt1 (Ser-473) probed with anti-Akt1 antibody. B Bar represents relative change in pAkt2 (Ser-474) probed with anti-Akt2 antibody. C Post-insulin stimulation, lysates were subjected to immunoprecipitation using anti-Akt3 antibody. Bar represents relative change in pAkt (Ser-473) probed with anti-Akt3 antibody. D Three days post-proliferation, N2A cells were transfected with double (Akt−2–3, Akt−1–3 or Akt−1–2) specific siRNA and then differentiated under MF MFI condition for 3 days. Differentiated N2A cells were serum starved for 2 h, followed by 100 nM insulin for 30 min. Uptake of 2-NBDG was then measured. E Subcellular translocation of Akt isoforms post-insulin stimulation. N2A cells were differentiated under MF MFI condition for 3 days and stimulated with or without 100 nM insulin for 30 min as indicated. Cells were lysed, and membrane and cytosol fraction were isolated and subjected to western blotting, followed by probing with relevant primary antibodies. Bar represents relative change in Akt1, Akt2 or Akt3 when probed with anti-Akt isoform specific antibody. F Subcellular translocation of AS160 post-insulin stimulation. Bar represents relative change in pAS160 (Thr-642) when probed with anti-AS160 antibody. GAPDH has been used as a loading control. Experiments were executed three times and a representative result is shown. Data expressed are mean ± SE. ***P < 0.001, **P < 0.01, *P < 0.05 compared to lane 1 or as indicated; ###P < 0.001, ##P < 0.01, #P < 0.05 compared to lane 2. IP Immunoprecipitation; IB Immunoblot; A.U Arbitrary Units


