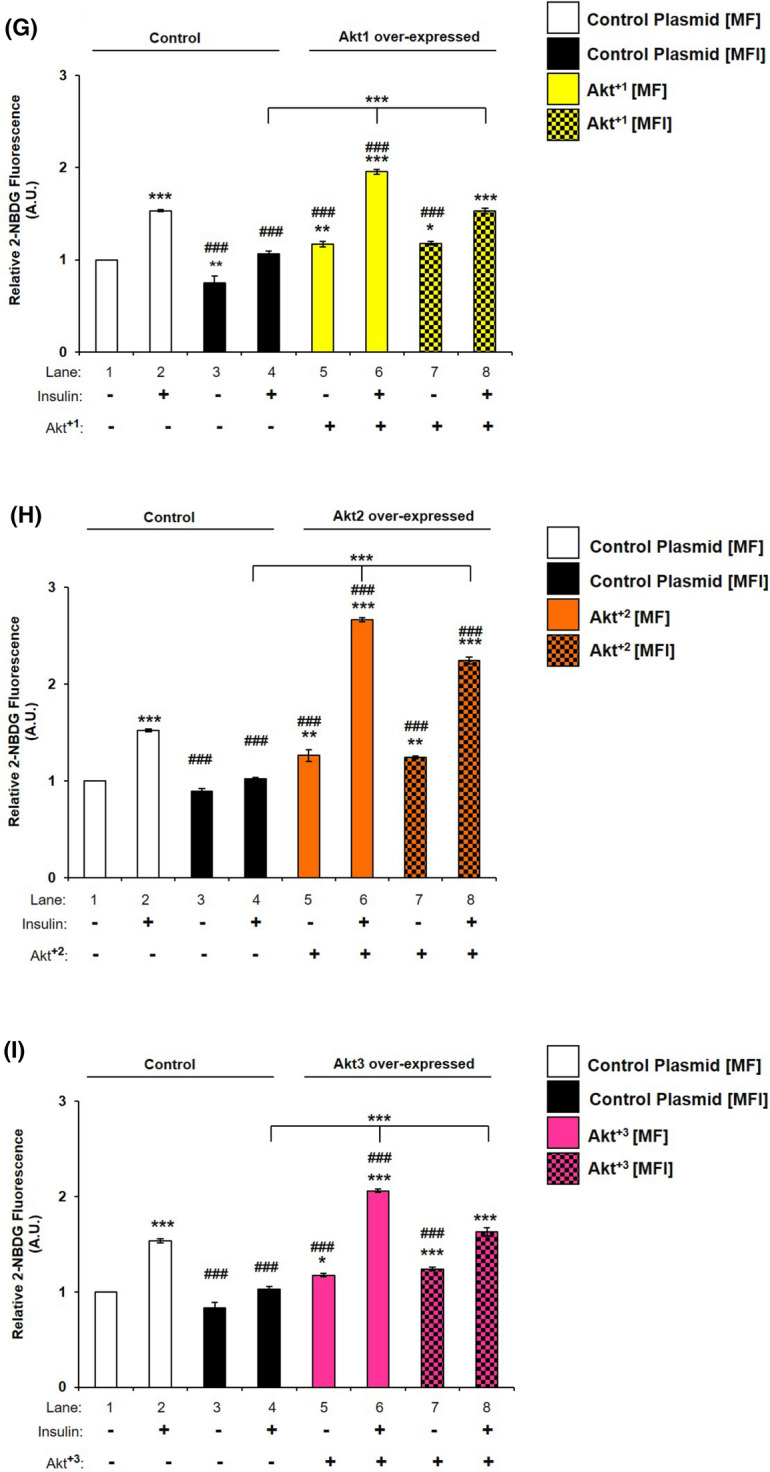
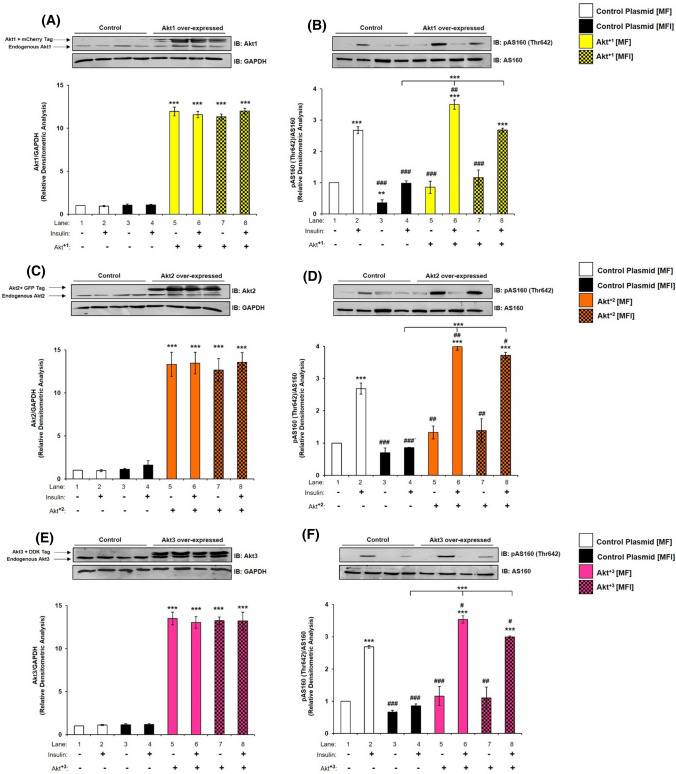
Fig. 9.

Effect of Akt1, Akt2, and Akt3 over-expression on expression and activation of AS160, and neuronal glucose uptake under insulin-resistant condition in neuronal cells. A–F Three days post-proliferation, Akt1, Akt2 or Akt3 were over-expressed using isoform specific plasmids. N2A cells were differentiated in serum-free medium in the absence of (MF) or chronic presence of 100 nM insulin (MFI) for 3 days. Cells were lysed and subjected to western blotting, followed by probing with relevant primary antibodies. Bar represents relative change when probed with anti-Akt isoform specific antibody. A, C, E Bar represents relative change in Akt1/Akt2/Akt3 probed with anti-Akt isoform specific antibody. GAPDH was used as loading control B, D, F Bar represents relative change in pAS160 (Thr-642) when probed with anti-AS160 antibody. G–I Three days post-proliferation, Akt1, Akt2 or Akt3 were over-expressed using isoform specific plasmids. N2A cells were differentiated in serum-free medium in the absence of (MF) or chronic presence of 100 nM insulin (MFI) for 3 days. N2A cells were serum starved for 2 h, followed by 100 nM insulin for 30 min. Uptake of 2-NBDG was then measured. Experiments were executed three times and a representative result is shown. Data expressed are mean ± SE. ***P < 0.001, **P < 0.01, *P < 0.05 compared to lane 1 or as indicated, ###P < 0.001, ##P < 0.01, #P < 0.05 compared to lane 2. IB Immunoblot; A.U Arbitrary Units

