
Fig. 5.
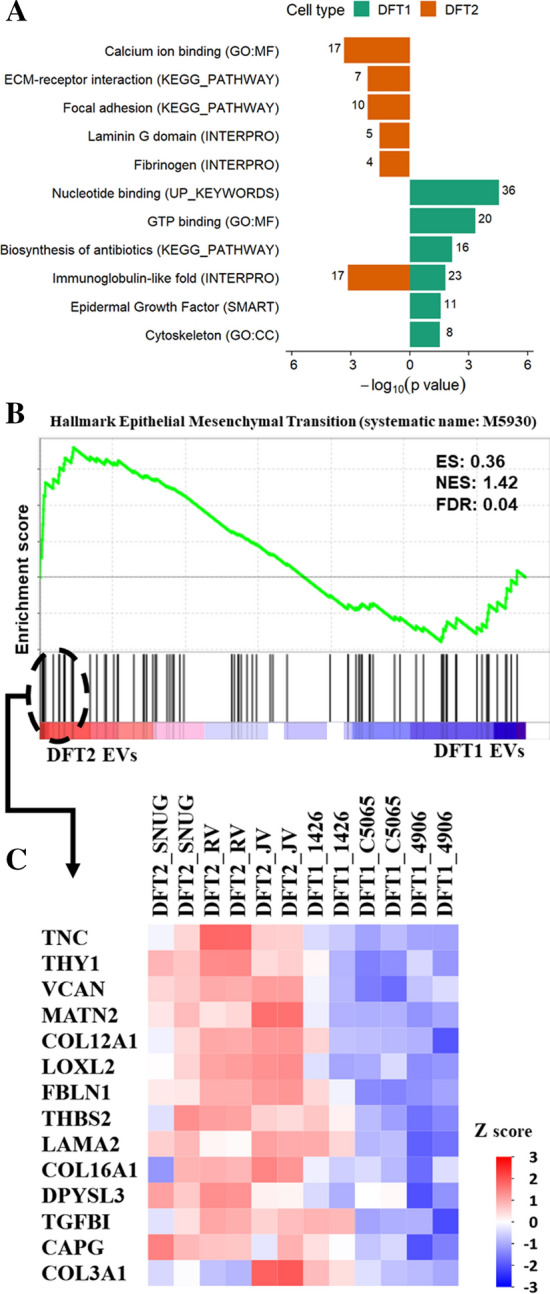
DFT2-derived EVs enriched the epithelial–mesenchymal transition hallmark relative to DFT1-derived EVs. A. Over-representing analysis (ORA) for gene ontology (GO) terms, protein families, and pathways of the EV proteins significantly upregulated in DFT1 (138) relative to DFT2 (294) (FDR-corrected p ≤ 0.05). The total number of proteins included in each functional term is denoted by a number on the edge of each bar. B. Enrichment plot contains enrichment score (ES), normalized enrichment score (NES), and FDR-corrected p value. The bottom portion of the plot shows the genes belonging to the hallmark, and they are ranked according to their differential expression. Higher and lower expressions are represented by red and blue colour, respectively. C Heat map showing the core list of proteins that contribute the most to the Epithelial–Mesenchymal Transition Hallmark