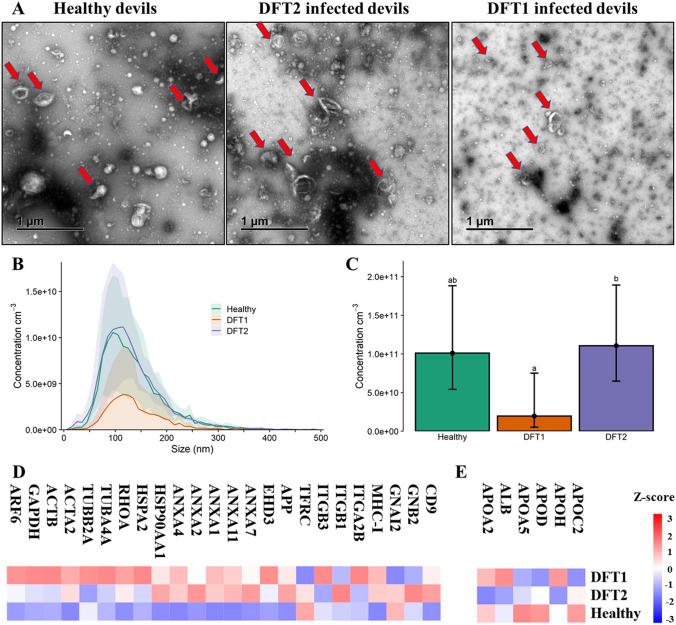
Fig. 6.
Characterisation of extracellular vesicles (EVs) derived from Tasmanian devil serum. A. Transmission electron microscopy images for EVs isolated from serum of healthy control captive devils (n = 4), DFT1-infected devils (n = 4), and DFT2-infected devils (n = 5). Red arrows indicate EV structures. B. Size distribution profiles determined by nanoparticle tracking analysis (NTA) of EVs isolated from serum of captive healthy control devils (n = 4), DFT1-infected devils (n = 4), and DFT2-infected devils (n = 5). Shaded areas represent 95% confidence intervals. C EV concentrations of the same NTA groups. The letters “a” and “b” indicate significant pairwise differences among groups (i.e., groups denoted with the same letter are not significantly different; one-way ANOVA, Tukey post hoc test, p < 0.05). Error bars represent 95% confidence intervals. D. Heat map of intensity values of commonly recovered EV proteins, and E. serum contaminants found in EV samples derived from captive healthy controls devils (n = 10), DFT1-infected devils (n = 12), and devils infected with DFT2 (n = 5)

