Fig. 7.
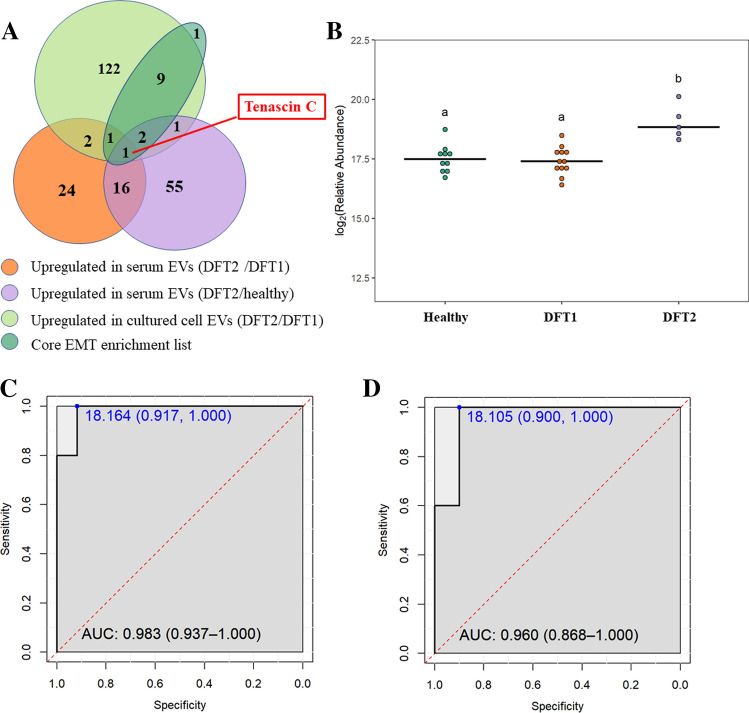
The mesenchymal protein TNC as a potential biomarker for DFT2. A. Venn diagram of overlapping proteins identified as: (a) upregulated in EVs derived from devils infected with DFT2 relative to devils infected with DFT1; (b) upregulated in EVs derived from devils infected with DFT2 relative to healthy controls; (c) upregulated in EVs derived from DFT2 cultured cells relative to DFT1 cultured cells; and (d) the core list of mesenchymal proteins that contribute the most to the epithelial–mesenchymal transition hallmark enrichment in EVs derived from DFT2 cultured cells. Note that one protein in the core enrichment list was present, but not significantly upregulated in DFT2 cultured cell EVs. B. Dot plot showing the relative abundance of EV TNC detected in 10 healthy, 12 DFT1-infected devils, and 5 DFT2-infected devils, different letters “a” and “b” indicate significant pairwise differences between groups (i.e., groups denoted with the same letter are not significantly different; one-way ANOVA and Tukey post hoc test, p < 0.05). C. Receiver-operating characteristic (ROC) curve analysis for TNC EVs (5 DFT2-infected devils relative to 12 DFT1-infected devils). D. ROC curve analysis for TNC EVs (5 DFT2 infected devils relative to 10 healthy controls). For both C and D, the dashed red line indicates random performance. The cut-off values were determined using Youden’s index and are indicated in blue at the left top corner of the ROC curve, and specificity and sensitivity are indicated in brackets, respectively

