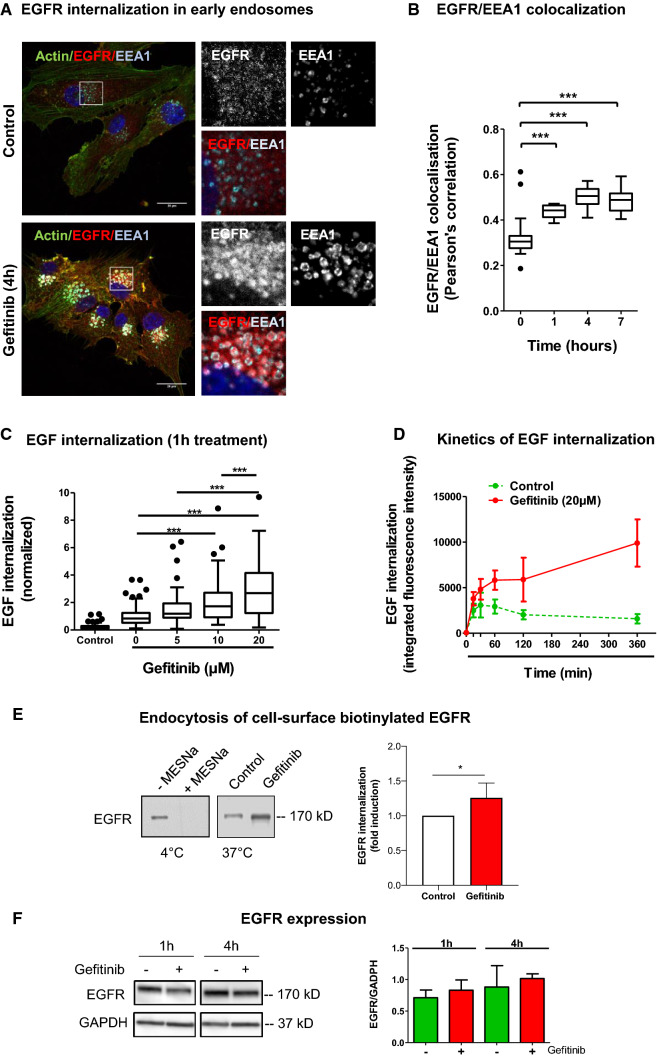
Fig. 1.
Gefitinib provokes EGFR endocytosis in U87 cells. a Immunodetection of actin (green), EGFR (red) and the endosomal marker EEA1 (cyan) after 4 h treatment with DMSO (control cells) or gefitinib (20 µM). Magnified images are from the inserts to the peri-nuclear area. Scale bar = 20 μm. b EGFR/EEA1 colocalization following gefitinib treatment. We collected 10–12 images from 3 independent experiments. ***p < 0.001. c–d EGF-Alexa488 internalization in U87 cells. Following serum-starvation and EGF-Alexa488 binding to the cell surface, cells were replaced in complete medium at 37 °C to allow internalization of the ligand, in presence of the indicated concentration of gefitinib. The internalization was measured by integrated fluorescence density of 20–30 cells from 3 independent experiments. c Cells were treated with different concentrations of gefitinib (5-20 µM) for 1 h at 37 °C incubation. ***p < 0.001. d Cells were treated with 20 µM of gefitinib for 15 min to 6 h. Data are represented as mean ± s.d. e Left panel: Immunoblot showing the endocytosis of biotinylated EGFR. Following cell-surface biotinylation, cells were incubated in complete media (with or without 15 µM gefitinib) for 3 h. Cells were treated with MESNa agent to remove biotin present on cell-surface proteins. After purification, biotinylated proteins were then subjected EGFR immunoblot. Right panel: Quantification of EGFR protein bands (mean of 4 independent experiment). *p < 0.05. f Left panel: Immunoblot showing similar EGFR protein expression in gefitinib-treated and untreated cells. Right panel: Quantification of EGFR/GAPDH protein ratio (mean of 3 independent experiments)

