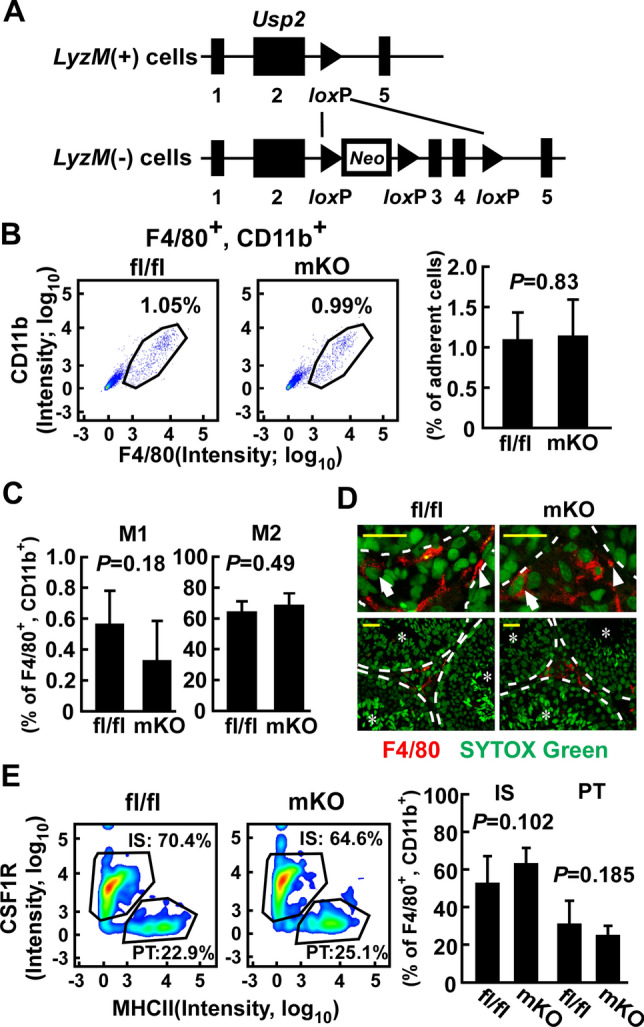
Fig. 1.

Effect of myeloid-selective Usp2 knockout on the proportion of the macrophage subpopulation in the testis. a Schematic presentation of the Usp2 locus of LyzM ( +) and (−) cells. Exon numbers and loxP sites are shown. Neo represents the neomycin-resistant gene. b-e: Myeloid-selective Usp2 knockout mice (mKO) and Usp2fl/fl mice (fl/fl) were subjected to FACS analysis (b, c, e) and histological analysis (d). b The proportion of F4/80+, CD11b+ macrophages in the testicular adherent cell fraction. Representative flow cytometry scatter plots (left panels) and quantification of the macrophages (right panel) are shown. c Proportion of Ly6chigh, CD206− M1 macrophages (left) and Ly6cint, CD206+ M2 macrophages (right) in F4/80+, CD11b+ cells. d Representative images of interstitial (arrows) and peritubular (arrowheads) macrophages in the testis that were stained with an anti-F4/30 antibody. The top panels show an enlarged view of the bottom panels. Seminiferous tubules are shown by dashed lines and asterisks. Scale bars represent 20 µm. Data were reproducibly obtained from three individual mice. e The proportion of CSF1R+, MHCII− interstitial (IS) and CSF1R−, MHCII+ peritubular (PT) macrophages in F4/80+, CD11b+ cells. Representative flow cytometry scatter plots (left panels) and quantification of IS and PT macrophages (right panel) are shown. Data are shown as the means ± SD of five mice (b, c, e). P values are shown in each graph (b, c, e)
