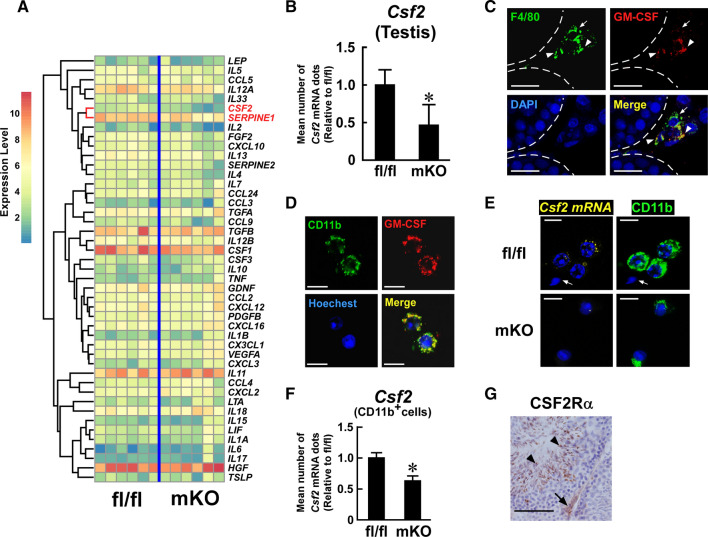
Fig. 7.
Effect of myeloid-selective Usp2 knockout on Csf2 expression in the testis. a Comprehensive qRT-PCR for cytokine expression in the testis of myeloid-selective Usp2 knockout mice (mKO) and Usp2fl/fl mice (fl/fl). The clustering tree is drawn on the left of the heatmap. The Csf2 and Serpine 1 rows are highlighted. b qRT-PCR analysis of Csf2 expression in the testis. Data were normalized to the level of Hprt1 expression. c, d Immunofluorescent detection of GM-CSF (red) and F4/80 (green, c) or CD11b (green, d) in the testis (c) or isolated testicular adherent cells (d) of C57BL/6 mice. Dashed lines show seminiferous tubules (c). Arrows and arrowheads indicate GM-CSF−, F4/80+ and GM-CSF+, F4/80+ cells, respectively (c). e, f Q-FISH analysis of Csf2 expression in the testicular adherent fraction of myeloid-selective Usp2 knockout mice (mKO) and Usp2fl/fl mice (fl/fl). Representative images for Q-FISH for Csf2 mRNA (e) and the mean abundance of Csf2 mRNA dots in CD11b+ cells (f) are shown. An arrow indicates sperm (e). The number of Csf2 mRNA dots were counted in 100 randomly selected CD11b+ cells in 10 microscopic fields for each mouse (f). g Representative images of CSF2 receptor α chain (CSF2R α)-immunostaining in the testis of C57BL/6 mice. An arrow and arrowheads indicate a CSF2R α+ spermatid and testicular interstitial cells, respectively. Nuclei were stained with DAPI (c), Hoechst33342 (d, e), and hematoxylin (g). Scale bars represent 20 µm (c, g) and 15 µm (d, e). Data are shown as means ± SD of six (b) or five (f) mice. Microscope analyses were reproducibly obtained from three (c, g), four (d), or seven (e) mice. *P < 0.05 vs Usp2fl/fl mice (b, f)

