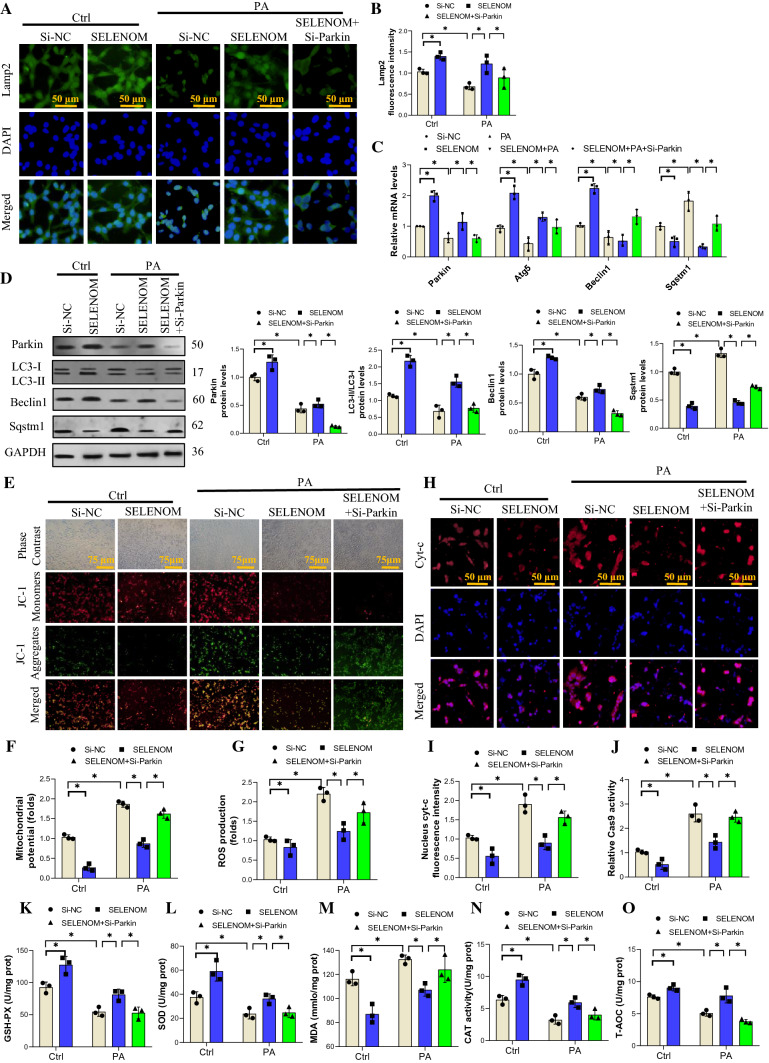
Fig. 7.
SELENOM regulates in PA-inhibited mitophagy by activating Parkin. A, B The immunofluorescent intensity of Lamp2 was verified via immunofluorescence assay in groups of Si-NC, SELENOM, PA + Si-NC, SELENOM + PA and SELENOM + PA + Si-Parkin (n = 3; *P < 0.05). Si-Parkin (50 nM) was used to block Parkin expression. Fields from one representative experiment of three are shown. C, D The mRNA and protein expression levels of mitophagy-related genes such as Parkin, LC3, Beclin1 and Sqstm1 were determined in hepatocytes of Si-NC, SELENOM, PA + Si-NC, SELENOM + PA and SELENOM + PA + Si-Parkin (n = 3; *P < 0.05). E, F Mitochondrial membrane potential was detected by the JC-1 staining (n = 3; *P < 0.05). Representative images were chosen from three independent biological samples (scale bar, 75 μm). G ROS production stained by DCFH-DA (5 mM) was measured by a fluorescence microplate reader. The data represent the mean ± SEM (n = 3; *P < 0.05). H, I Immunofluorescent intensity of Cyt-c was verified via immunofluorescence assay (n = 3; *P < 0.05). Fields from one representative experiment of three are shown (scale bar, 50 μm). J The mRNA of Cas 9 was determined in hepatocytes of Si-NC, SELENOM, PA + Si-NC, SELENOM + PA and SELENOM + PA + Si-Parkin (n = 3; *P < 0.05). K–O The contents of GSH-PX, SOD, MDA, CAT, T-AOC were measured in hepatocytes of Si-NC, SELENOM, PA + Si-NC, SELENOM + PA and SELENOM + PA + Si-Parkin (n = 3 per group, *P < 0.05 versus the difference between groups). The data represent the mean ± SEM

