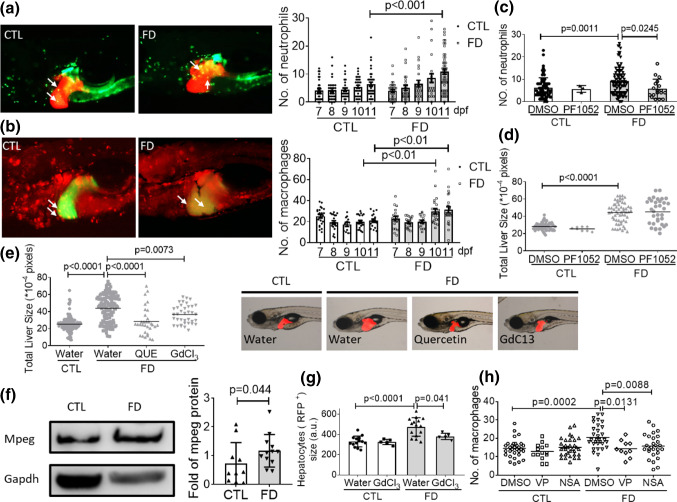
Fig. 10.
Inflammatory cells infiltration was observed in FD larval liver. The FD larvae, generated from Tg(lfabp:mCherry/hsp70: eGFP-γGH/mpx:eGFP) (a) and Tg(lfabp:eGFP/hsp70: mCherry-γGH/mpeg1:mCherry) (b), were imaged at 11 dpf. The number of neutrophil (green fluorescent dots in a) and macrophages (red fluorescent dots in (b)) was counted and recorded daily. Data were collected from at least three independent trials with total larvae number ranging from 23 to 57 for each group. The number of neutrophils in liver area (c) and liver size (d) of larvae exposed to PF1052 (0.1625 µM) starting from 7 dpf was examined at 11 dpf as described before. e The liver sizes of larvae exposed to macrophage inhibitors, quercetin (QUE, 2.5 µM) and GdCl3 (20 µM), were imaged and quantified at 11 dpf. Presented here are the averages of at least three independent trials with the total larval number of 24–47 for each group. f The liver extracts prepared from FD adult fish were subjected to Western blotting with anti-mpeg antibodies. The signal intensity of Mpeg was quantified with densitometry. g FACS analysis on the sizes of hepatocytes isolated from FD larvae revealed significant improvement for those in the group treated with GdCl3. The cell size obtained with flow cytometry (FSC) was reported in arbitrary units (a.u.). h Larvae were exposed to VP (Hippo pathway inhibitor, 0.62 µM) and NSA (necroptosis inhibitor, 5 µM) starting from 7 dpf and counted for the number of macrophages in larval liver area. Shown here are the averaged results of at least five independent trials with each sample prepared from 20 to 30 larvae. Statistical results are represented in the mean ± SEM. CTL control (larvae or adult fish without FD), FD folate deficiency

