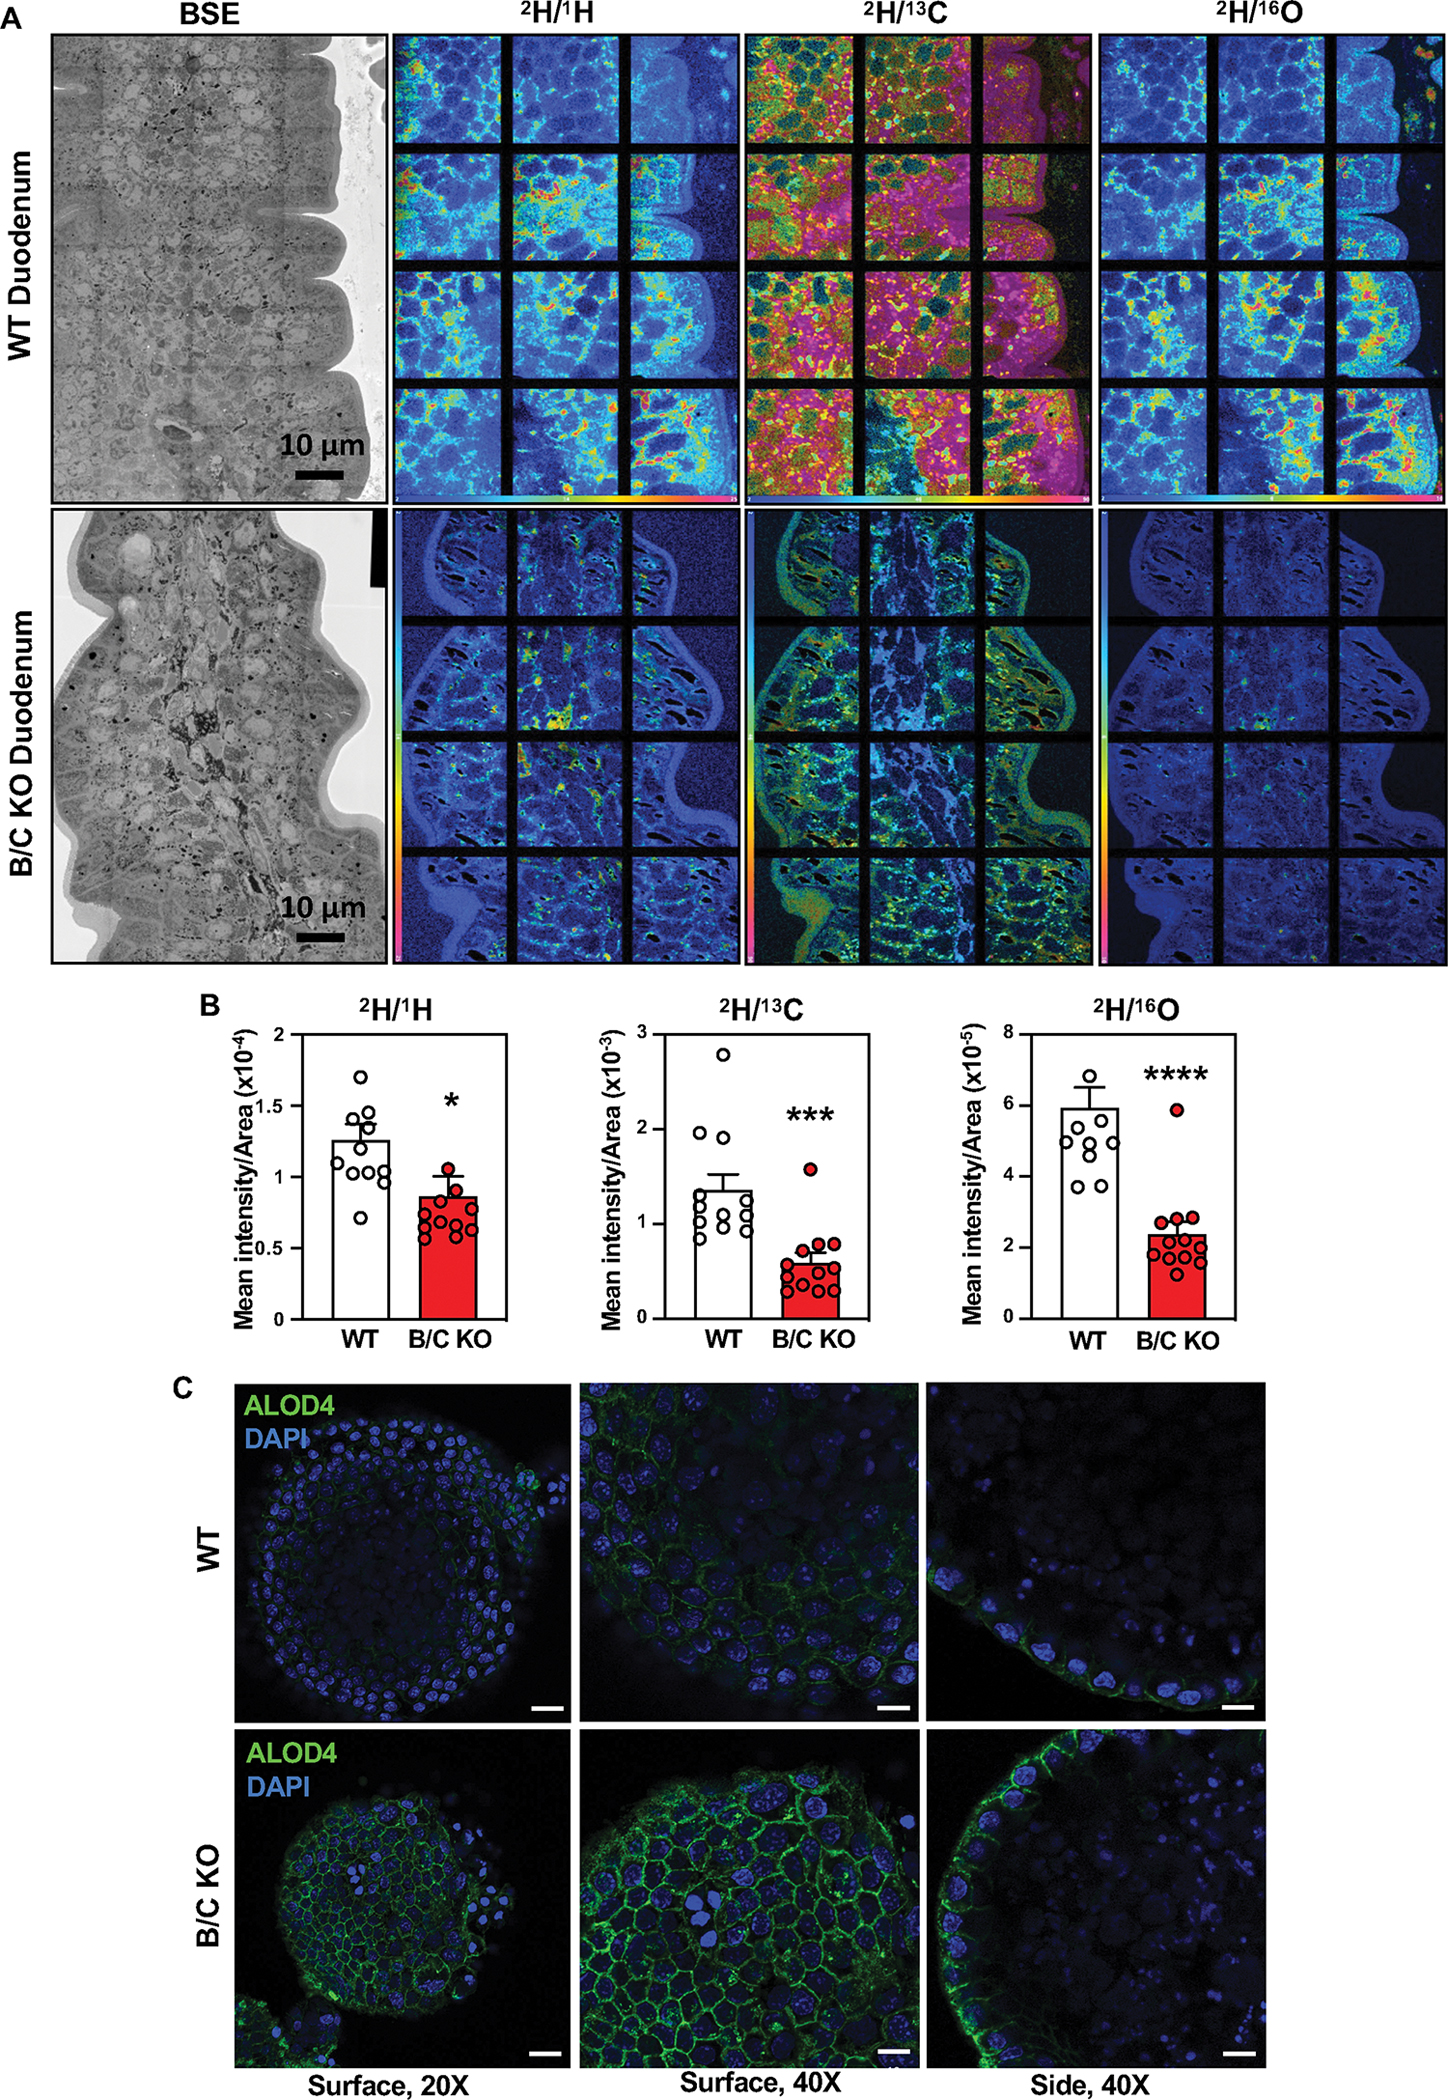
Fig. 2: Deletion of Asters reduces cholesterol internalization from the plasma membrane.

(A) Backscattered electron images and NanoSIMS images of a mid-duodenum villus from WT and B/C KO mice. (B) Quantification of the 2H− secondary ion signal, normalized to the 1H−, 13C−, and 16O− signals. (C) ALOD4 imaging of murine enteroids from WT and B/C KO mice 2 h after loading with MβCD cholesterol For left panels, scale bar is 20 μm. For middle and right panels scale bar is 10 μm. Data are expressed as mean ± SEM. Statistical analysis: unpaired t test; *p < 0.05, ***p < 0.001, ****p < 0.0001.
