Fig. 3.

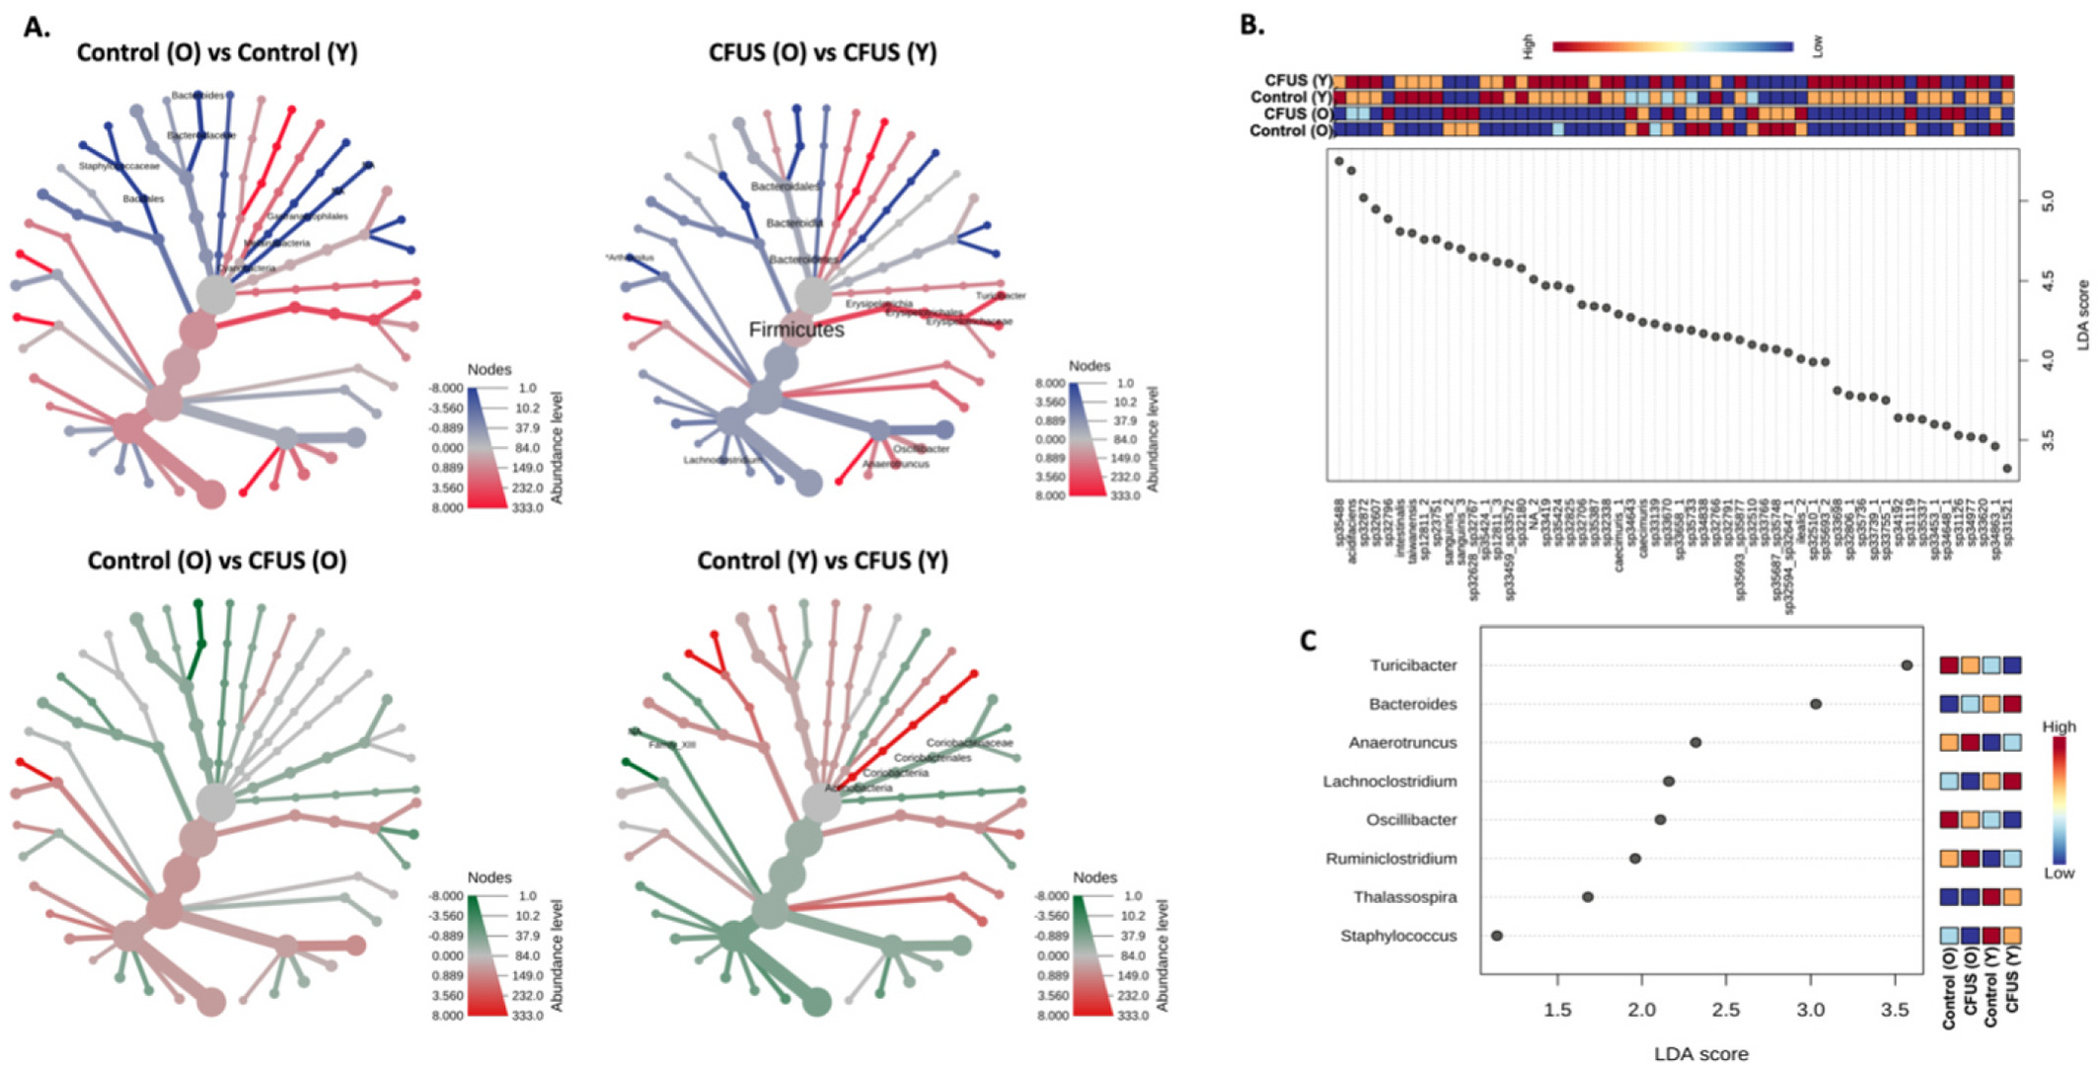
Comparative analysis among treatment groups revealed significant differences in microbial taxa with age and treatment. A. Phylogenetic tree representing comparative analysis between two treatment groups using non-parametric Wilcoxon test at different taxa levels. B. Multifactor Lefse analysis of all four treatment groups at Feature levels yielded 152 significantly different populations, mostly at species levels, out of which 56 with the highest LDA score are represented in the dot plot. Whereas, at the genus level (C.) 8 significantly different populations among treatment groups were observed.
