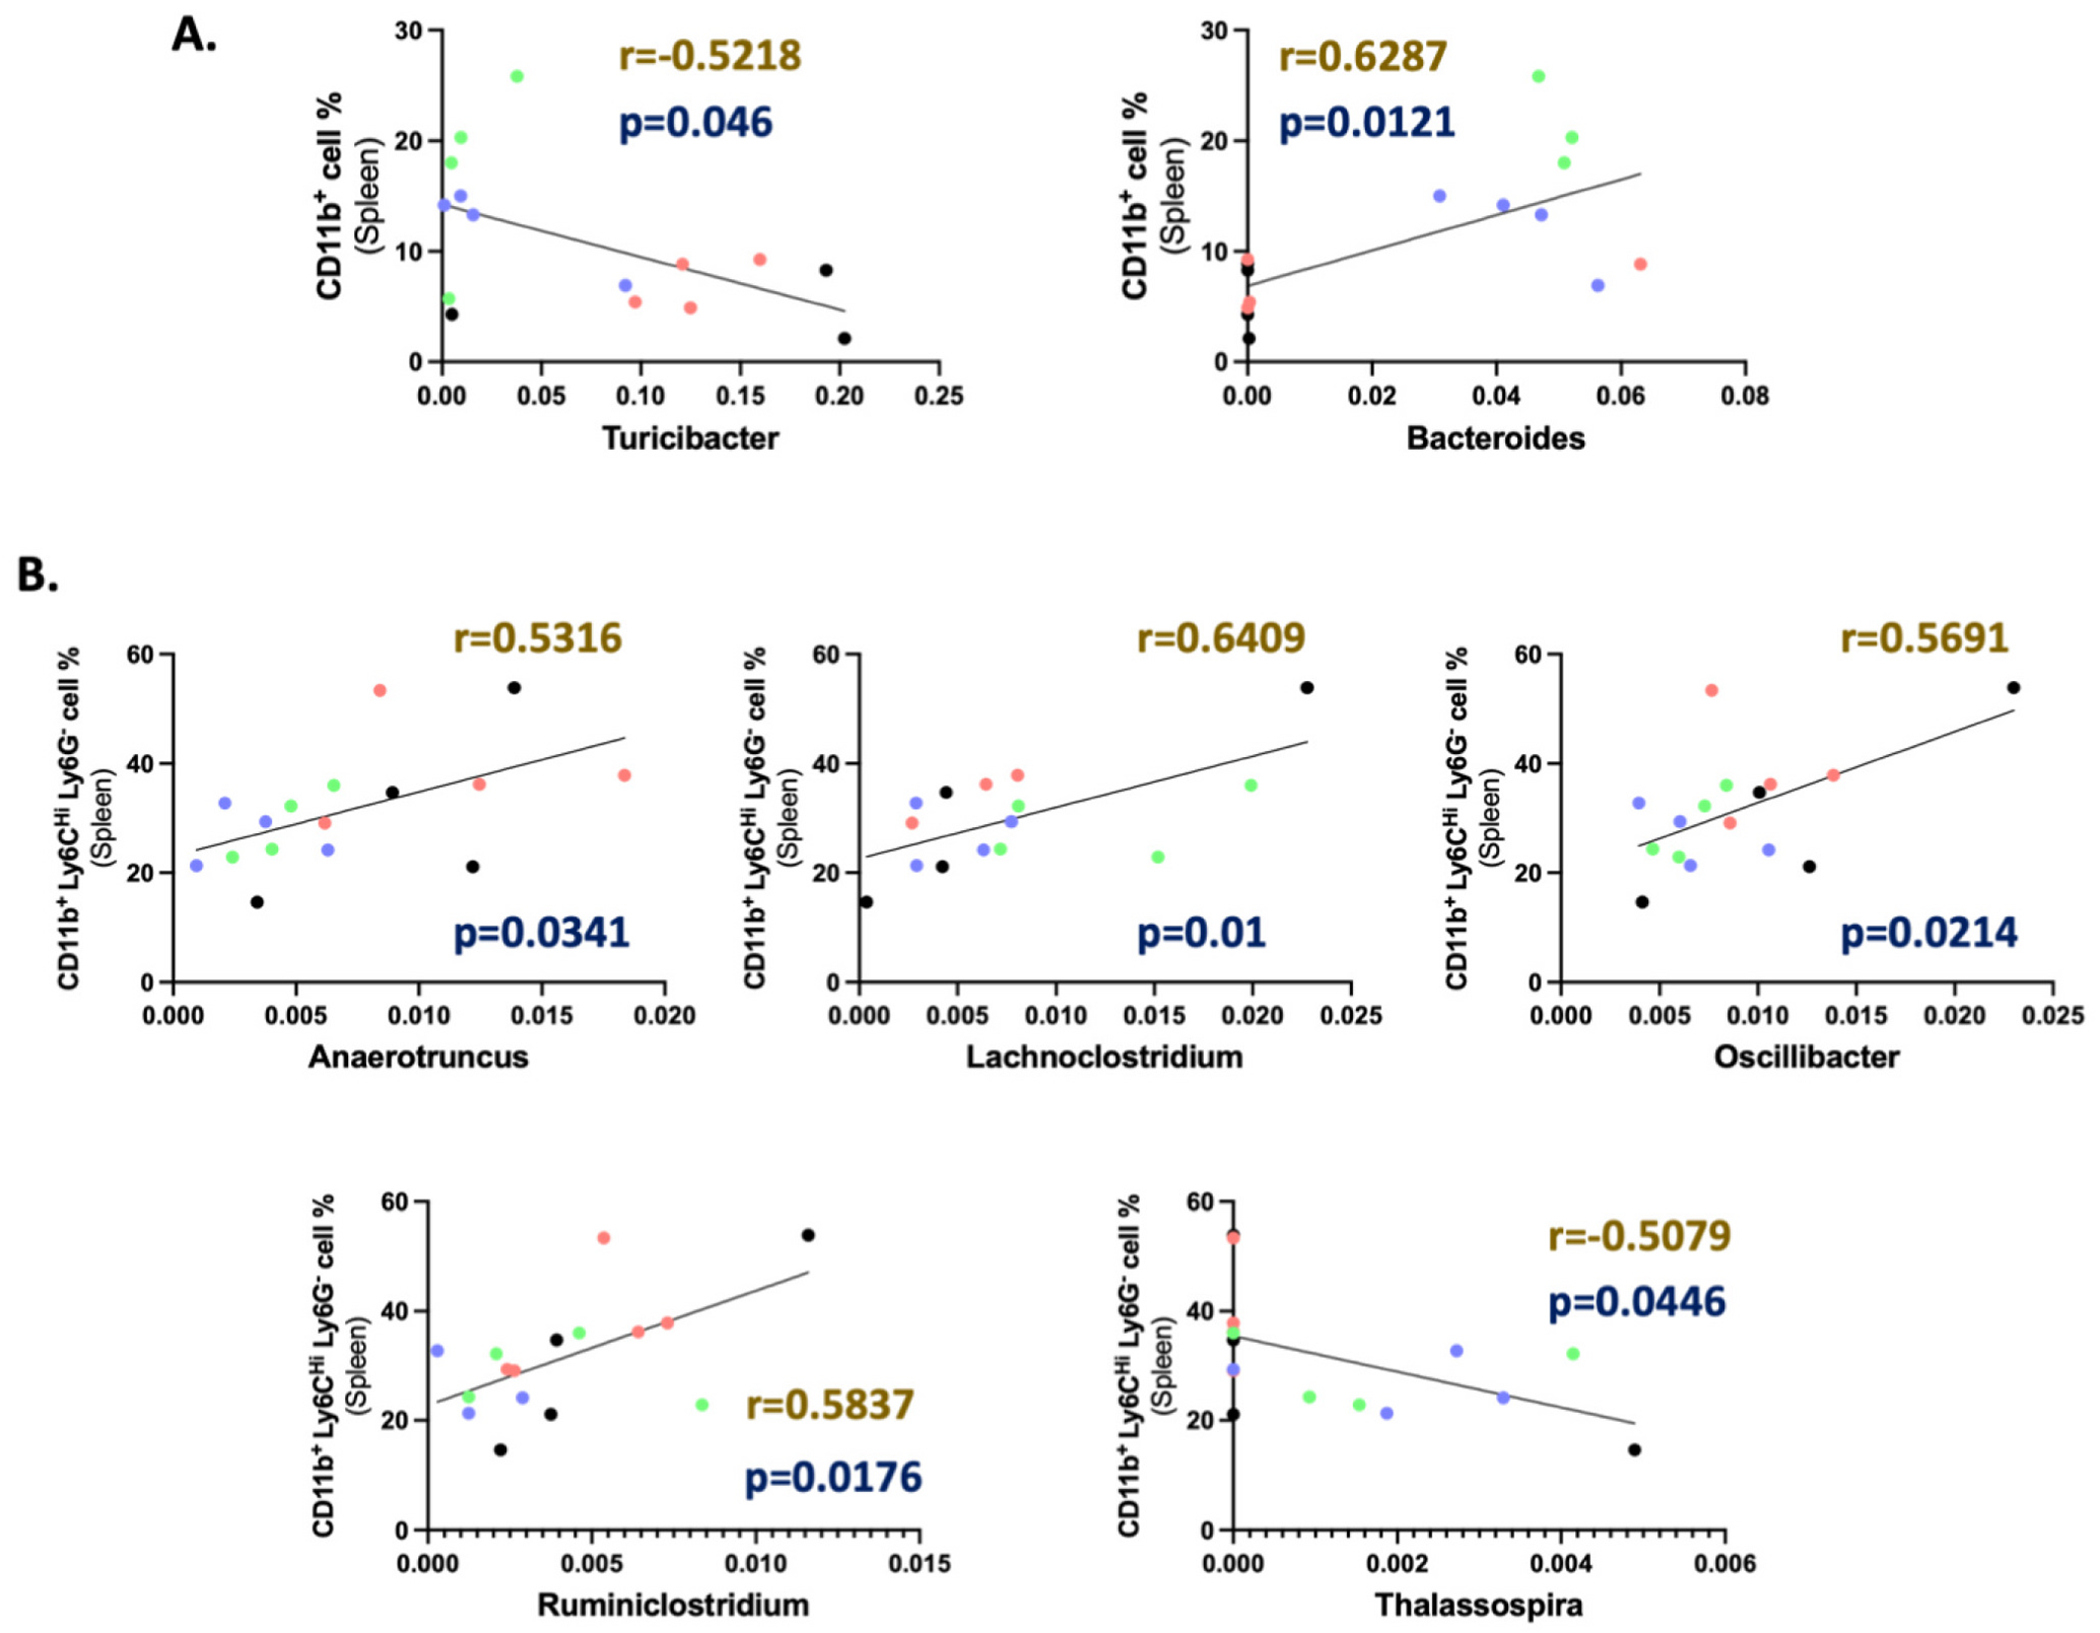
Fig. 5.

Pearson r correlation of identified genus with splenic myeloid population. Correlation graphs representing significant (p < 0.05) linear correlation between (A) CD11b+ macrophages (Gated at CD45 CD11c−), (B) Ly6CHi Ly6G− M-MDSCs (Gated at CD45+ CD11c− CD11b+) population in the spleen with the gut abundance of different genera irrespective of treatment groups. Sample identification in the correlation graphs: Control (O)- Black, CFUS (O)- Red, Control (Y)- Blue, and CFUS (Y)- Green. (For interpretation of the references to color in this figure legend, the reader is referred to the web version of this article.)
