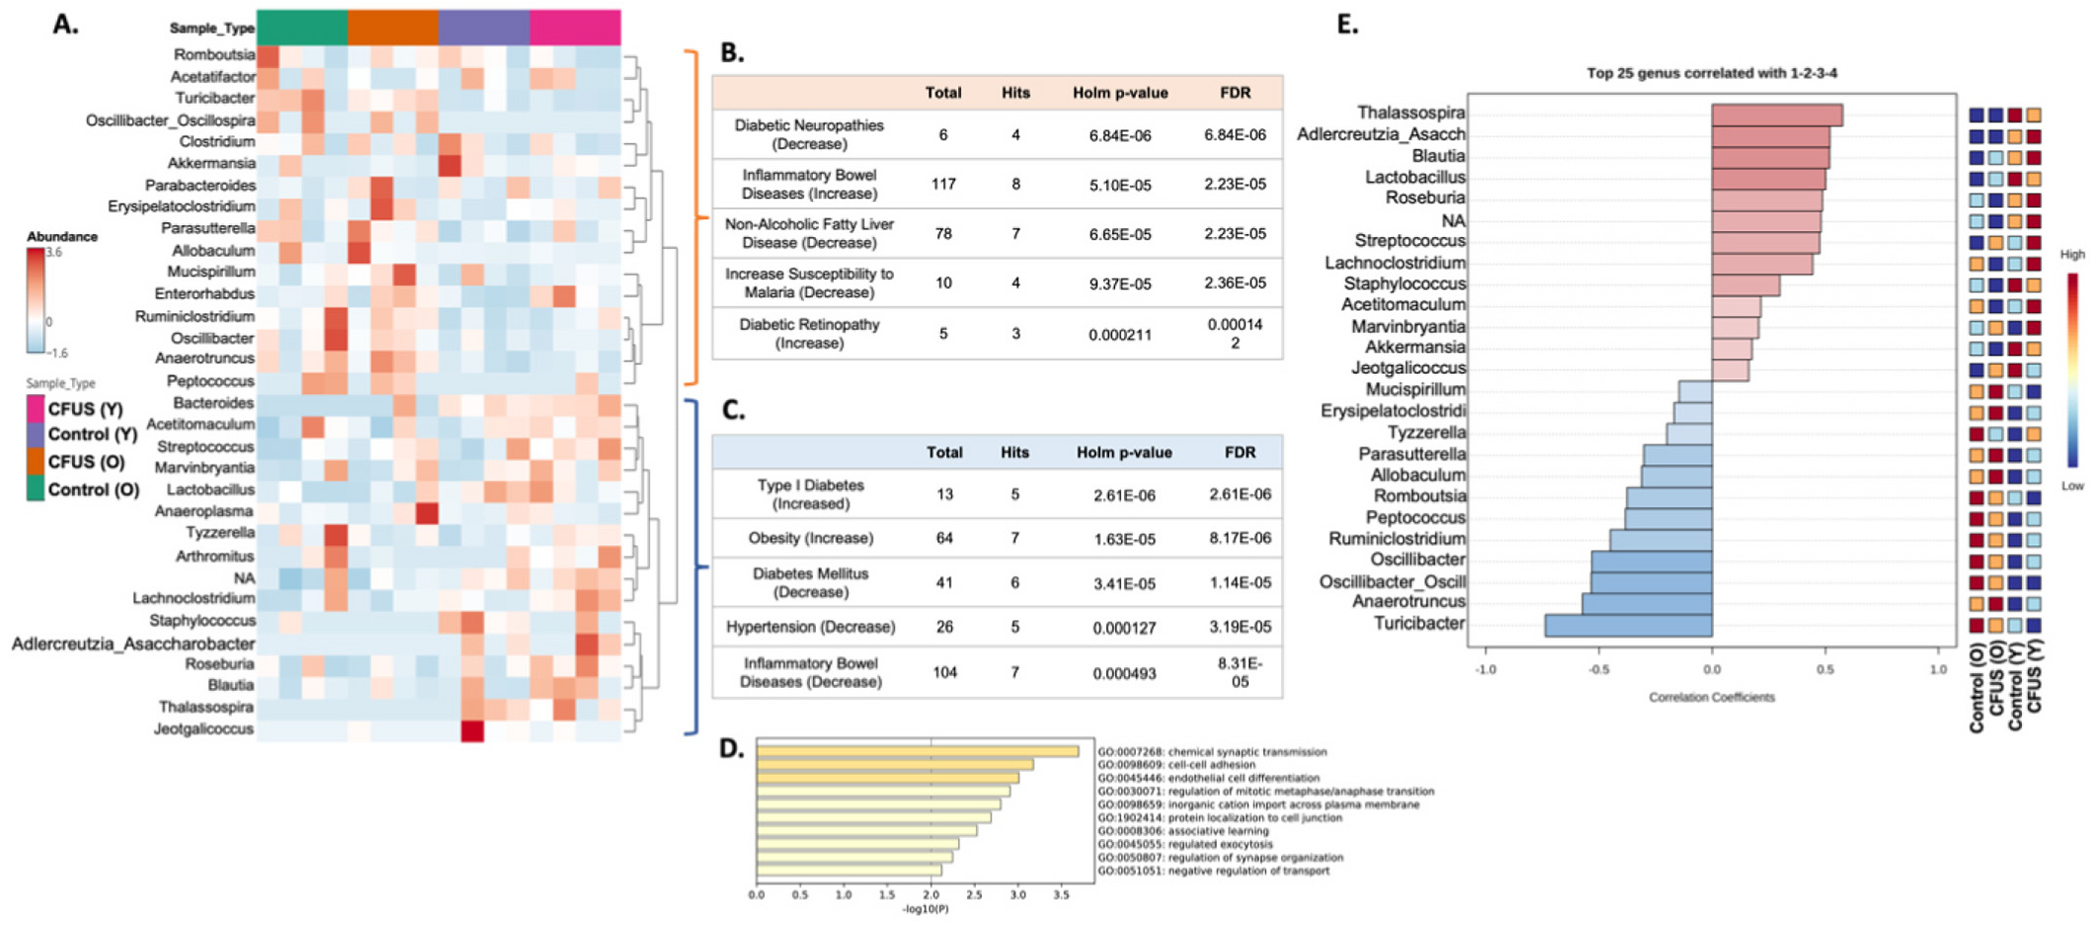
Fig. 6.

Community typing divided aged and young mice genera into two hierarchical clusters. A. Hierarchical clustering of different treatment groups divided aged and young mice populations into two clusters at the genus level. Taxon set enrichment analysis (TSEA) analysis of young mice clusters using Host-intrinsic taxon sets database hit 26 significant disease conditions (B.) and old mice cluster had 20 hits (C.) Top 5 hits for each cluster with lowest p values mentioned in tables. A complete list of significant hits is mentioned in Tables 4 and 5. TSEA using the Host genetics taxon sets database yielded 58 significantly enriched host gene targets for the young cluster whereas 11 for the aged cluster. D. Bar graph representing function groups for young cluster gene targets enriched using Metascape gene enrichment software. Genes predicted for the aged cluster did not enrich into any specific molecular or biological function group. E. Pearson r correlation graph demonstrating top 25 genera correlated to different treatment groups. Populations correlated using Pearson r analysis matches the hierarchical clustering of various genera with treatment groups.
