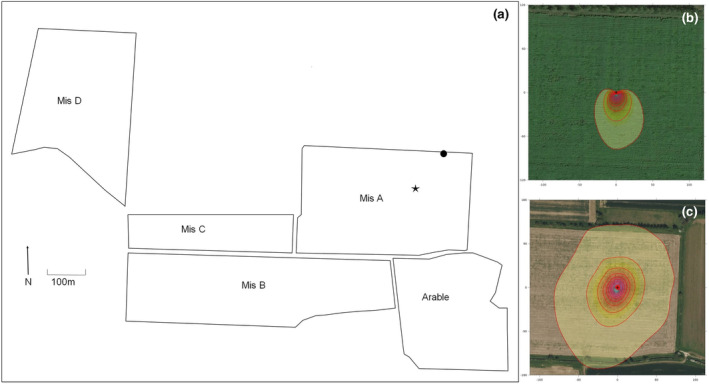
FIGURE 1.

Site map, showing location of the field which underwent remedial tillage in 2013 (Mis A), the remaining untilled Miscanthus fields, and the adjacent arable field (a). Composite yield data were provided by the company that manages the Miscanthus plantations, which included the additional field Mis C, and Mis D. The location of the eddy covariance (EC) tower within the Mis A field (black dot) and the location of the EC mast (star). Minimum (2013) and maximum (2017) extent of the EC footprint climatology are shown [panel (b) and (c), respectively]. Contour lines show contribution of the footprint to the flux measurement in steps of 10%, Flux tower is show as red dot. Footprints were generated via the Flux Footprint Prediction (FFP) online data processing tool (Kljun et al., 2015). For footprints for each year 2013–2017, see Supporting Information (Figure S2).
