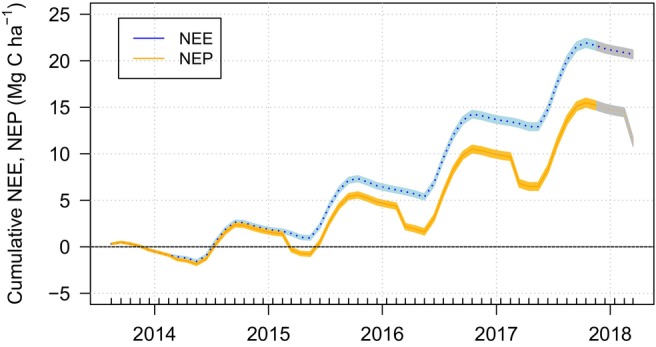
FIGURE 4.

Cumulative monthly sums of net ecosystem CO2 exchange (NEE, blue line and shading) and cumulative net ecosystem production (NEP, orange line and shading) for a commercial Miscanthus plantation in Lincolnshire, UK. The step changes in NEP represent the removal of carbon in harvested biomass (modelled yields), which is assumed to be returned to the atmosphere during combustion for energy generation. Shaded areas for the period December 2017 to March 2017 were estimated as averages of the data collected over previous years. Shaded areas show cumulative uncertainty estimates (2σ) calculated using standard error accumulation principles using the root sum square of two standard deviations calculated for each 30‐min CO2 flux density.
