FIGURE 5.

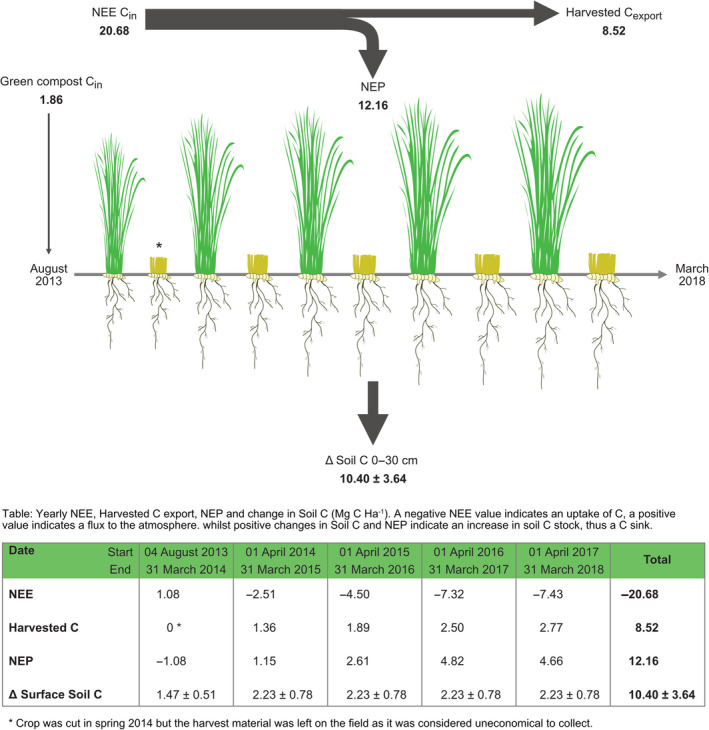
Summed C fluxes between July 2013 and March 2018 and estimated changes in soil C stock. Values are in Mg C ha−1 and harvested C export is based on modelled yields.

Summed C fluxes between July 2013 and March 2018 and estimated changes in soil C stock. Values are in Mg C ha−1 and harvested C export is based on modelled yields.