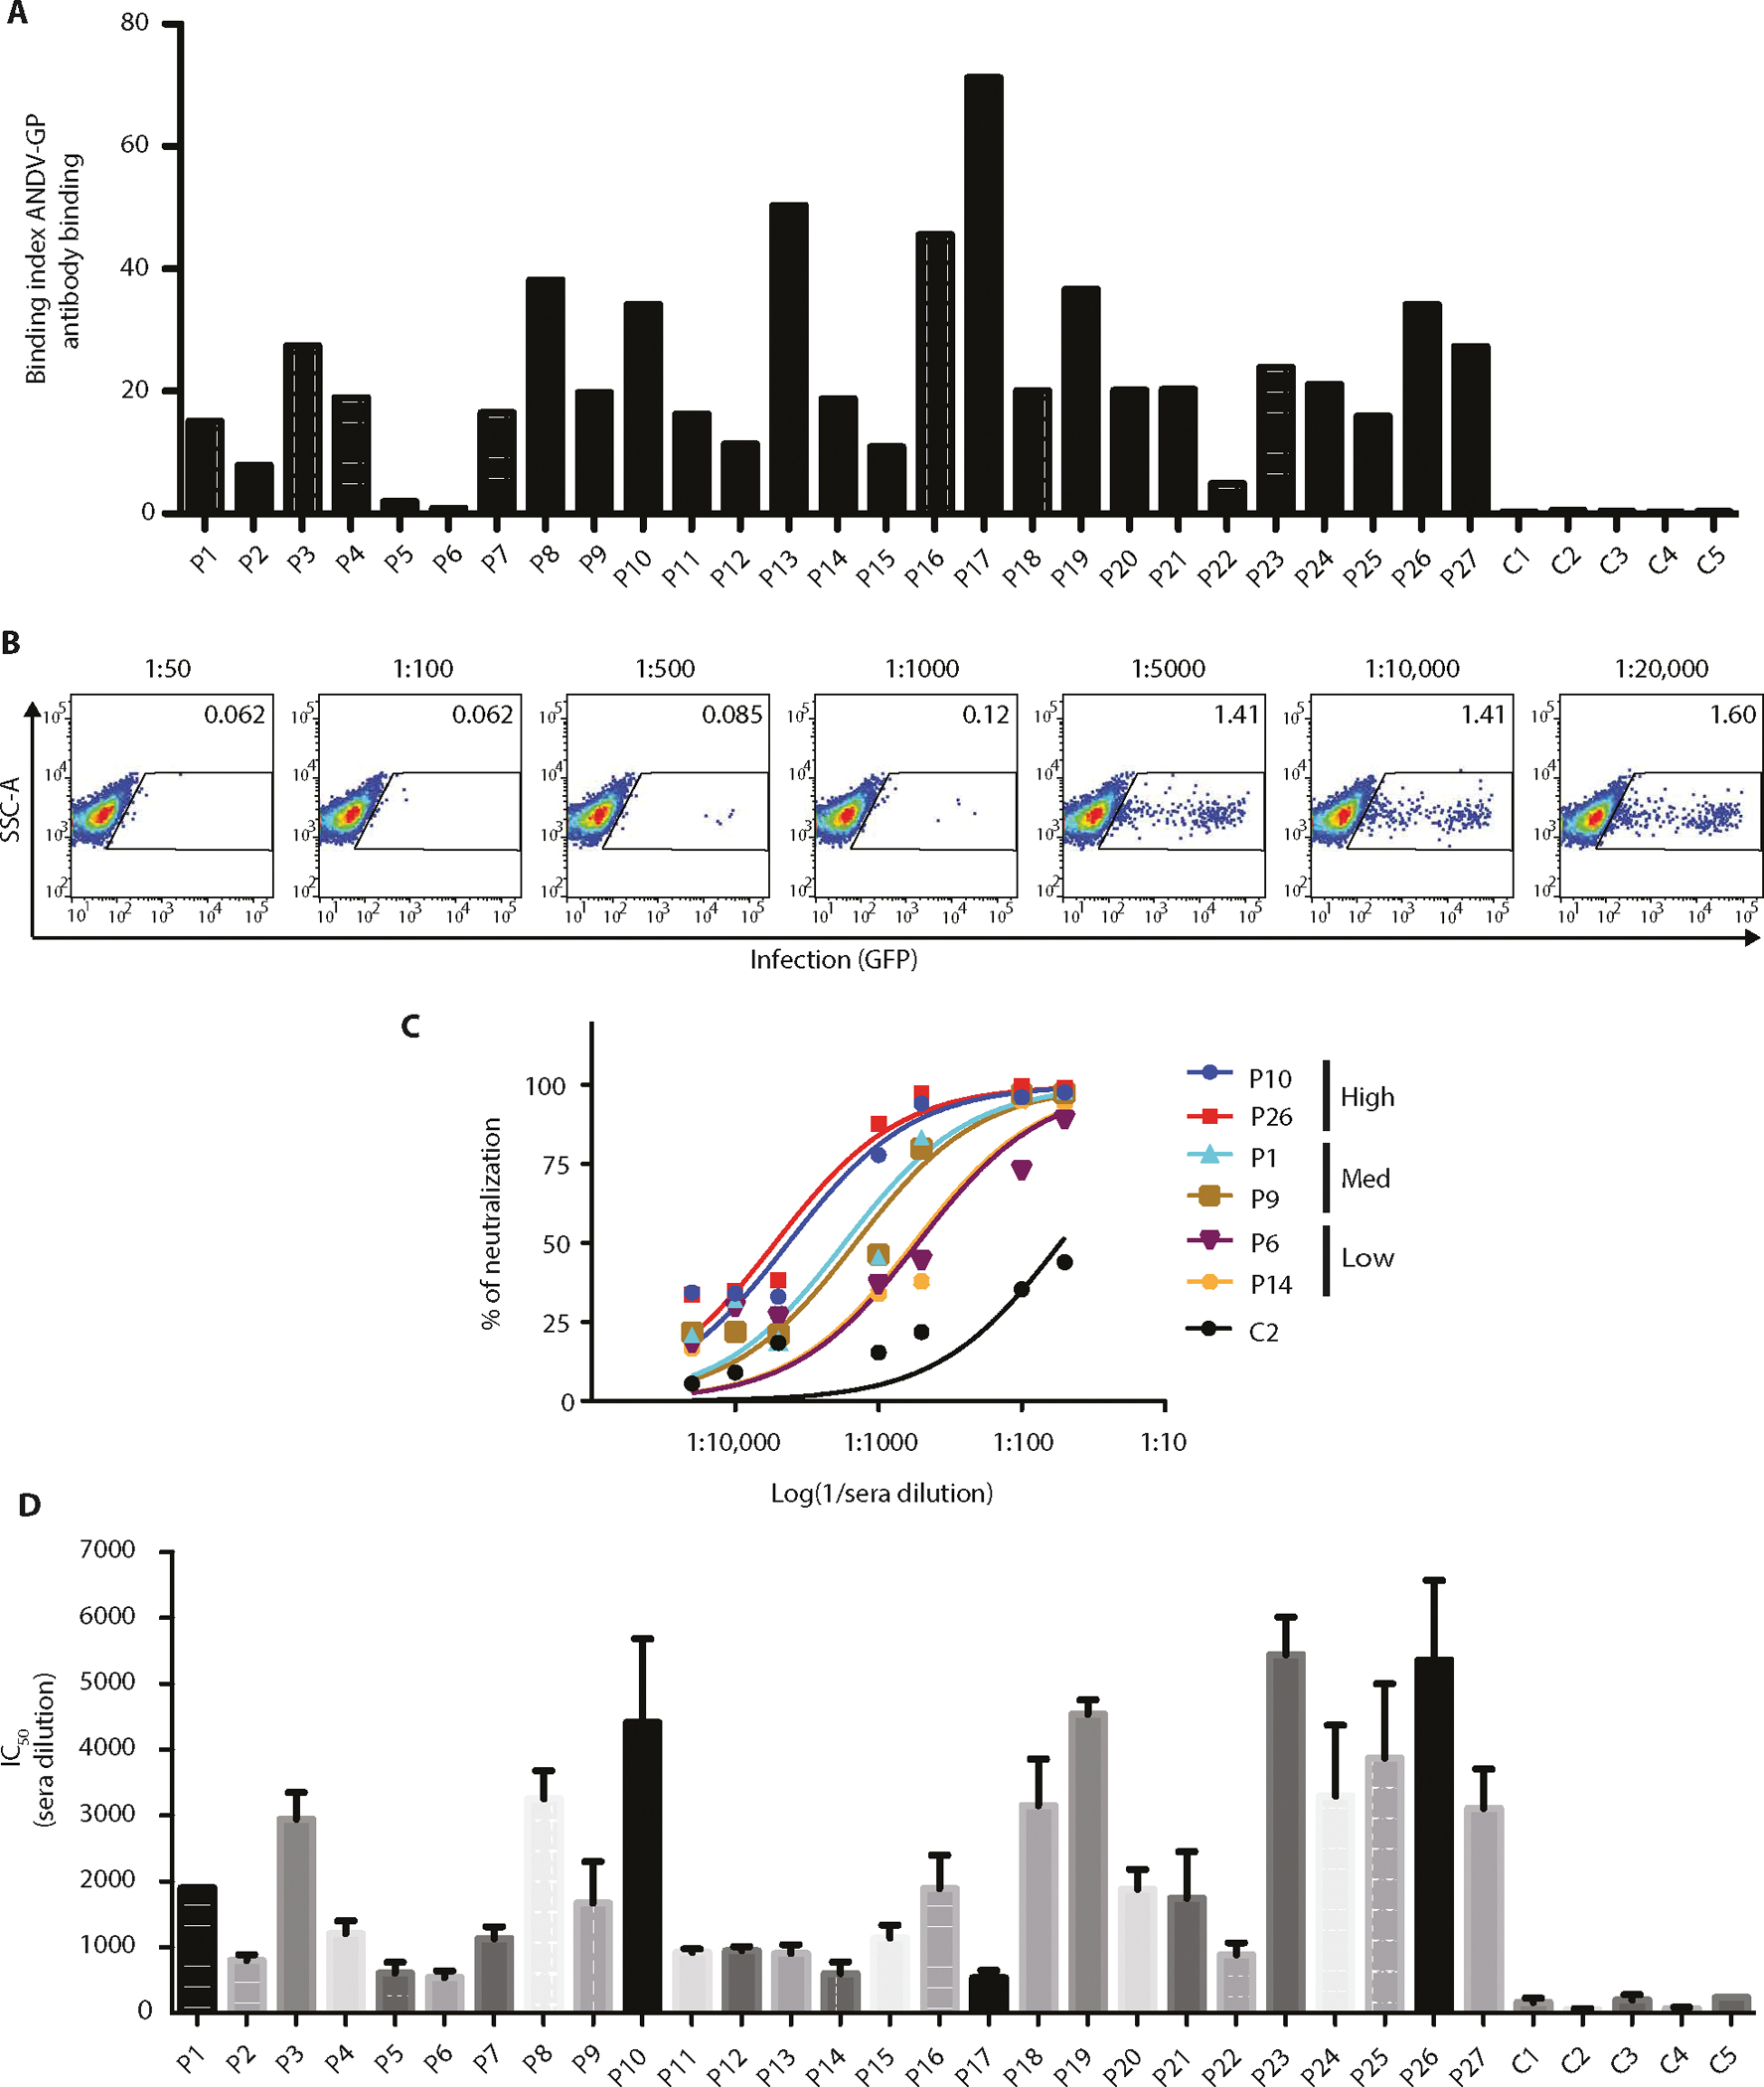
Fig. 1. Screening of sera reactive to ANDV-GP for mAb donor identification.

Binding and neutralization assays were performed with 27 ANDV convalescent sera. (A) Binding index analysis of ANDV-GP IgG sera using a cell-based assay. 293T cells expressing ANDV-GP were incubated with a 1:1000 dilution of sera from ANDV convalescent or healthy subjects followed by detection of total IgG by flow cytometry analysis (n = 1). (B) Representative ANDV pv neutralization assay is shown, and ANDV-GP pvs were incubated with sera from ANDV convalescent subject at different dilutions (1:50 to 1:20,000) and used to infect HEK293-IB3 cells. Upon productive infection, pseudoparticles produce GFP (n = 4). (C) Representative neutralization curves of ANDV convalescent sera with high, medium, and low neutralization activities and a healthy control (C2). The y axis displays the percent pseudovirus neutralization, and the x axis displays the reciprocal of the dilution (log) (n = 4; representative experiment is shown). (D) IC50 for 27 ANDV convalescent subjects and 5 healthy controls (n = 4). The y axis displays the reciprocal of the concentration. Error bars represent the SD of the mean. P1 to P27, ANDV convalescent subjects; C1 to C5, healthy control subjects.
