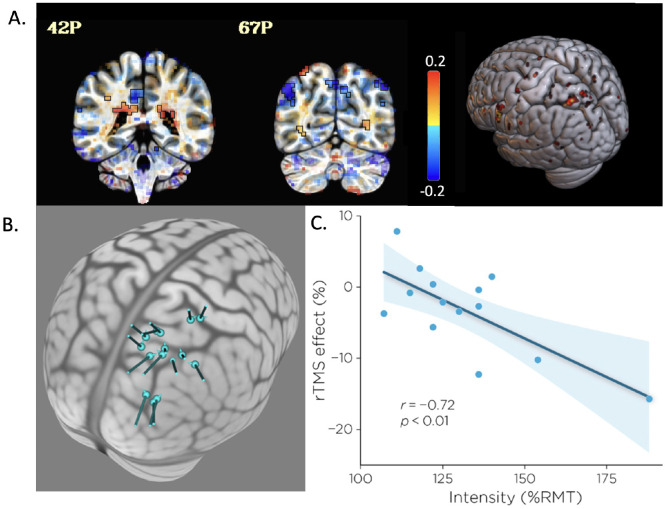
Fig 5. fMRI results, TMS targets, and correlations.
A) Group fMRI activation in the Incongruent > Congruent contrast. Colors show the effect estimate value. Each voxel is thresholded by its t-stat values and the transparent thresholding was applied [22] (Threshold: t = 2.11, bi-sided; p < .05) on a coronal and an axial view and on a 3D rendering (left is subject left). B) TMS target for each individual on an MNI brain, and C) correlation between stimulation intensity and rTMS effect.

