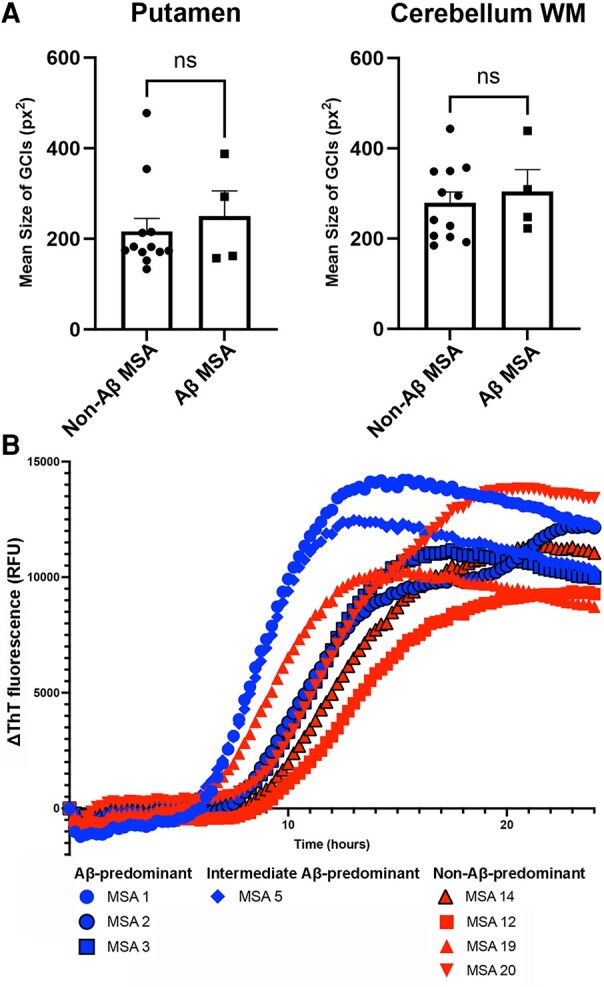
Figure 2.

GCIs morphometry and α-syn seeding amplification assay. (A) The mean size of α-syn-ir GCIs is similar between Aβ-predominant ADNC-MSA and non-Aβ-predominant ADNC-MSA cases in the putamen and cerebellum white matter (n = 4 versus 12). Mann–Whitney U test is applied for the statistics. (B) α-syn seeding amplification assay demonstrates that two cases (MSA 1, Aβ-predominant ADNC-MSA; MSA 5, intermediate form Aβ-predominant) exhibit distinctive seeding kinetics from others (2 Aβ-predominant ADNC-MSA and 4 non-Aβ-predominant ADNC-MSA). ns, not significant; RFU, relative fluorescent unit; WM, white matter.
