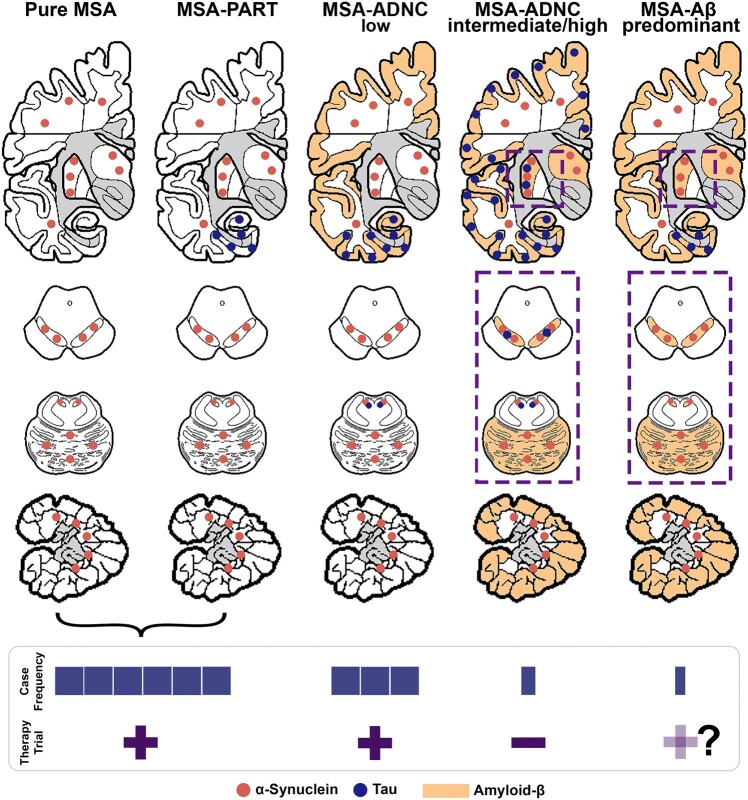
Figure 4.
Spectrum of mixed pathology of ADNC in MSA. Five constellations are shown: the most frequent is pure MSA pathology or MSA pathology associated with NFTs in the entorhinal cortex and hippocampus as in PART followed by low or less frequently intermediate and high levels of ADNC. The bar graph shows the case frequency of each subgroup. The dashed-line square represents the anatomical meeting points of multiple proteins. Regarding the consideration of using α-syn-targeted therapy in patients with high-level ADNC would largely be excluded due to the severe cognitive decline (indicated by a dash in the row indicating α-syn therapy trial). In contrast, cases of MSA with PART, MSA with low-level ADNC and Aβ-predominant ADNC-MSA groups might be included since the clinical phenotype is not significantly different (indicated by a ‘+’ in the row indicating α-syn therapy trial). Importantly, in Aβ-predominant ADNC-MSA cases, the possibility of an interaction between α-syn and Aβ is the highest, and therefore, this might have an effect on the outcome of the α-syn therapy trial and might justify the consideration of combined therapies separately targeting the two proteinopathies.

