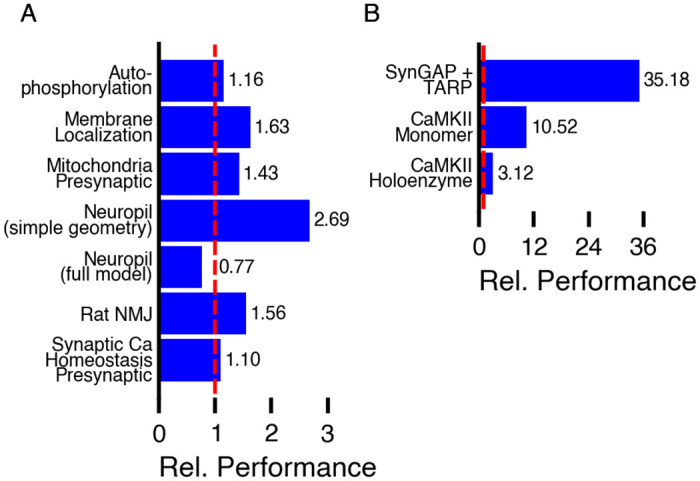
Fig 18. Performance benchmarks of MCell4.

For selected benchmarks, we measured elapsed time for how long the simulation ran starting from the second iteration (after all initializations) and ending when the simulation finished. Time was measured on AMD Ryzen 9 3900X@3.8GHz. Both MCell3 and MCell4 use a single execution thread. Relative performance shown in the graphs is computed as time for MCell3 (panel A) or MCell3-R (panel B) divided by time for MCell4. The sources of the models are as follows: Presynaptic Ca Homeostasis [39]; Rat Neuromuscular Junction [2] model with updated geometry (shown in Fig 1), Neuropil [5]; Mitochondrion Model [47]; Membrane Localization [41]; Autophosphorylation [41]; CaMKII Monomers [40]; CaMKII Holoenzyme [40]; SynGAP and TARP with the PDZ domains of PSD-95 (MCell4 model not yet published).
