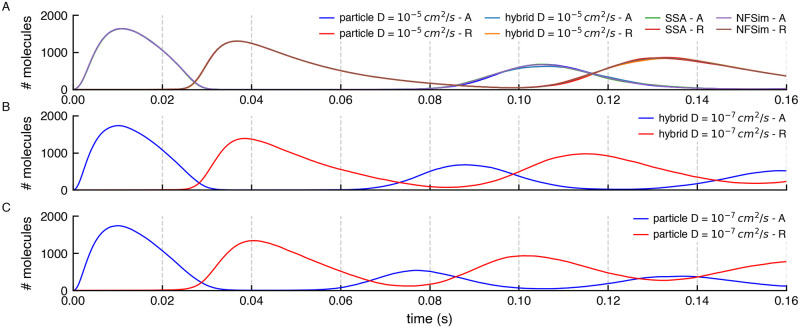
Fig 23. Comparison of copy numbers of A and R during simulations by different methods.
(A) The average copy numbers for A and R proteins from 1024 runs in NFsim, SSA, and MCell4 with a fast diffusion constant match. To get an even better match, would require more than 1024 runs because stochastic molecular simulations show high variability when the copy number of some of the species is low which is the case here for both A and R. (B) and (C) Average copy numbers for MCell4 simulations with a slow diffusion constant. These are shown as separate plots to highlight the effect of slow diffusion on spatial simulation results.

