Figure 1:

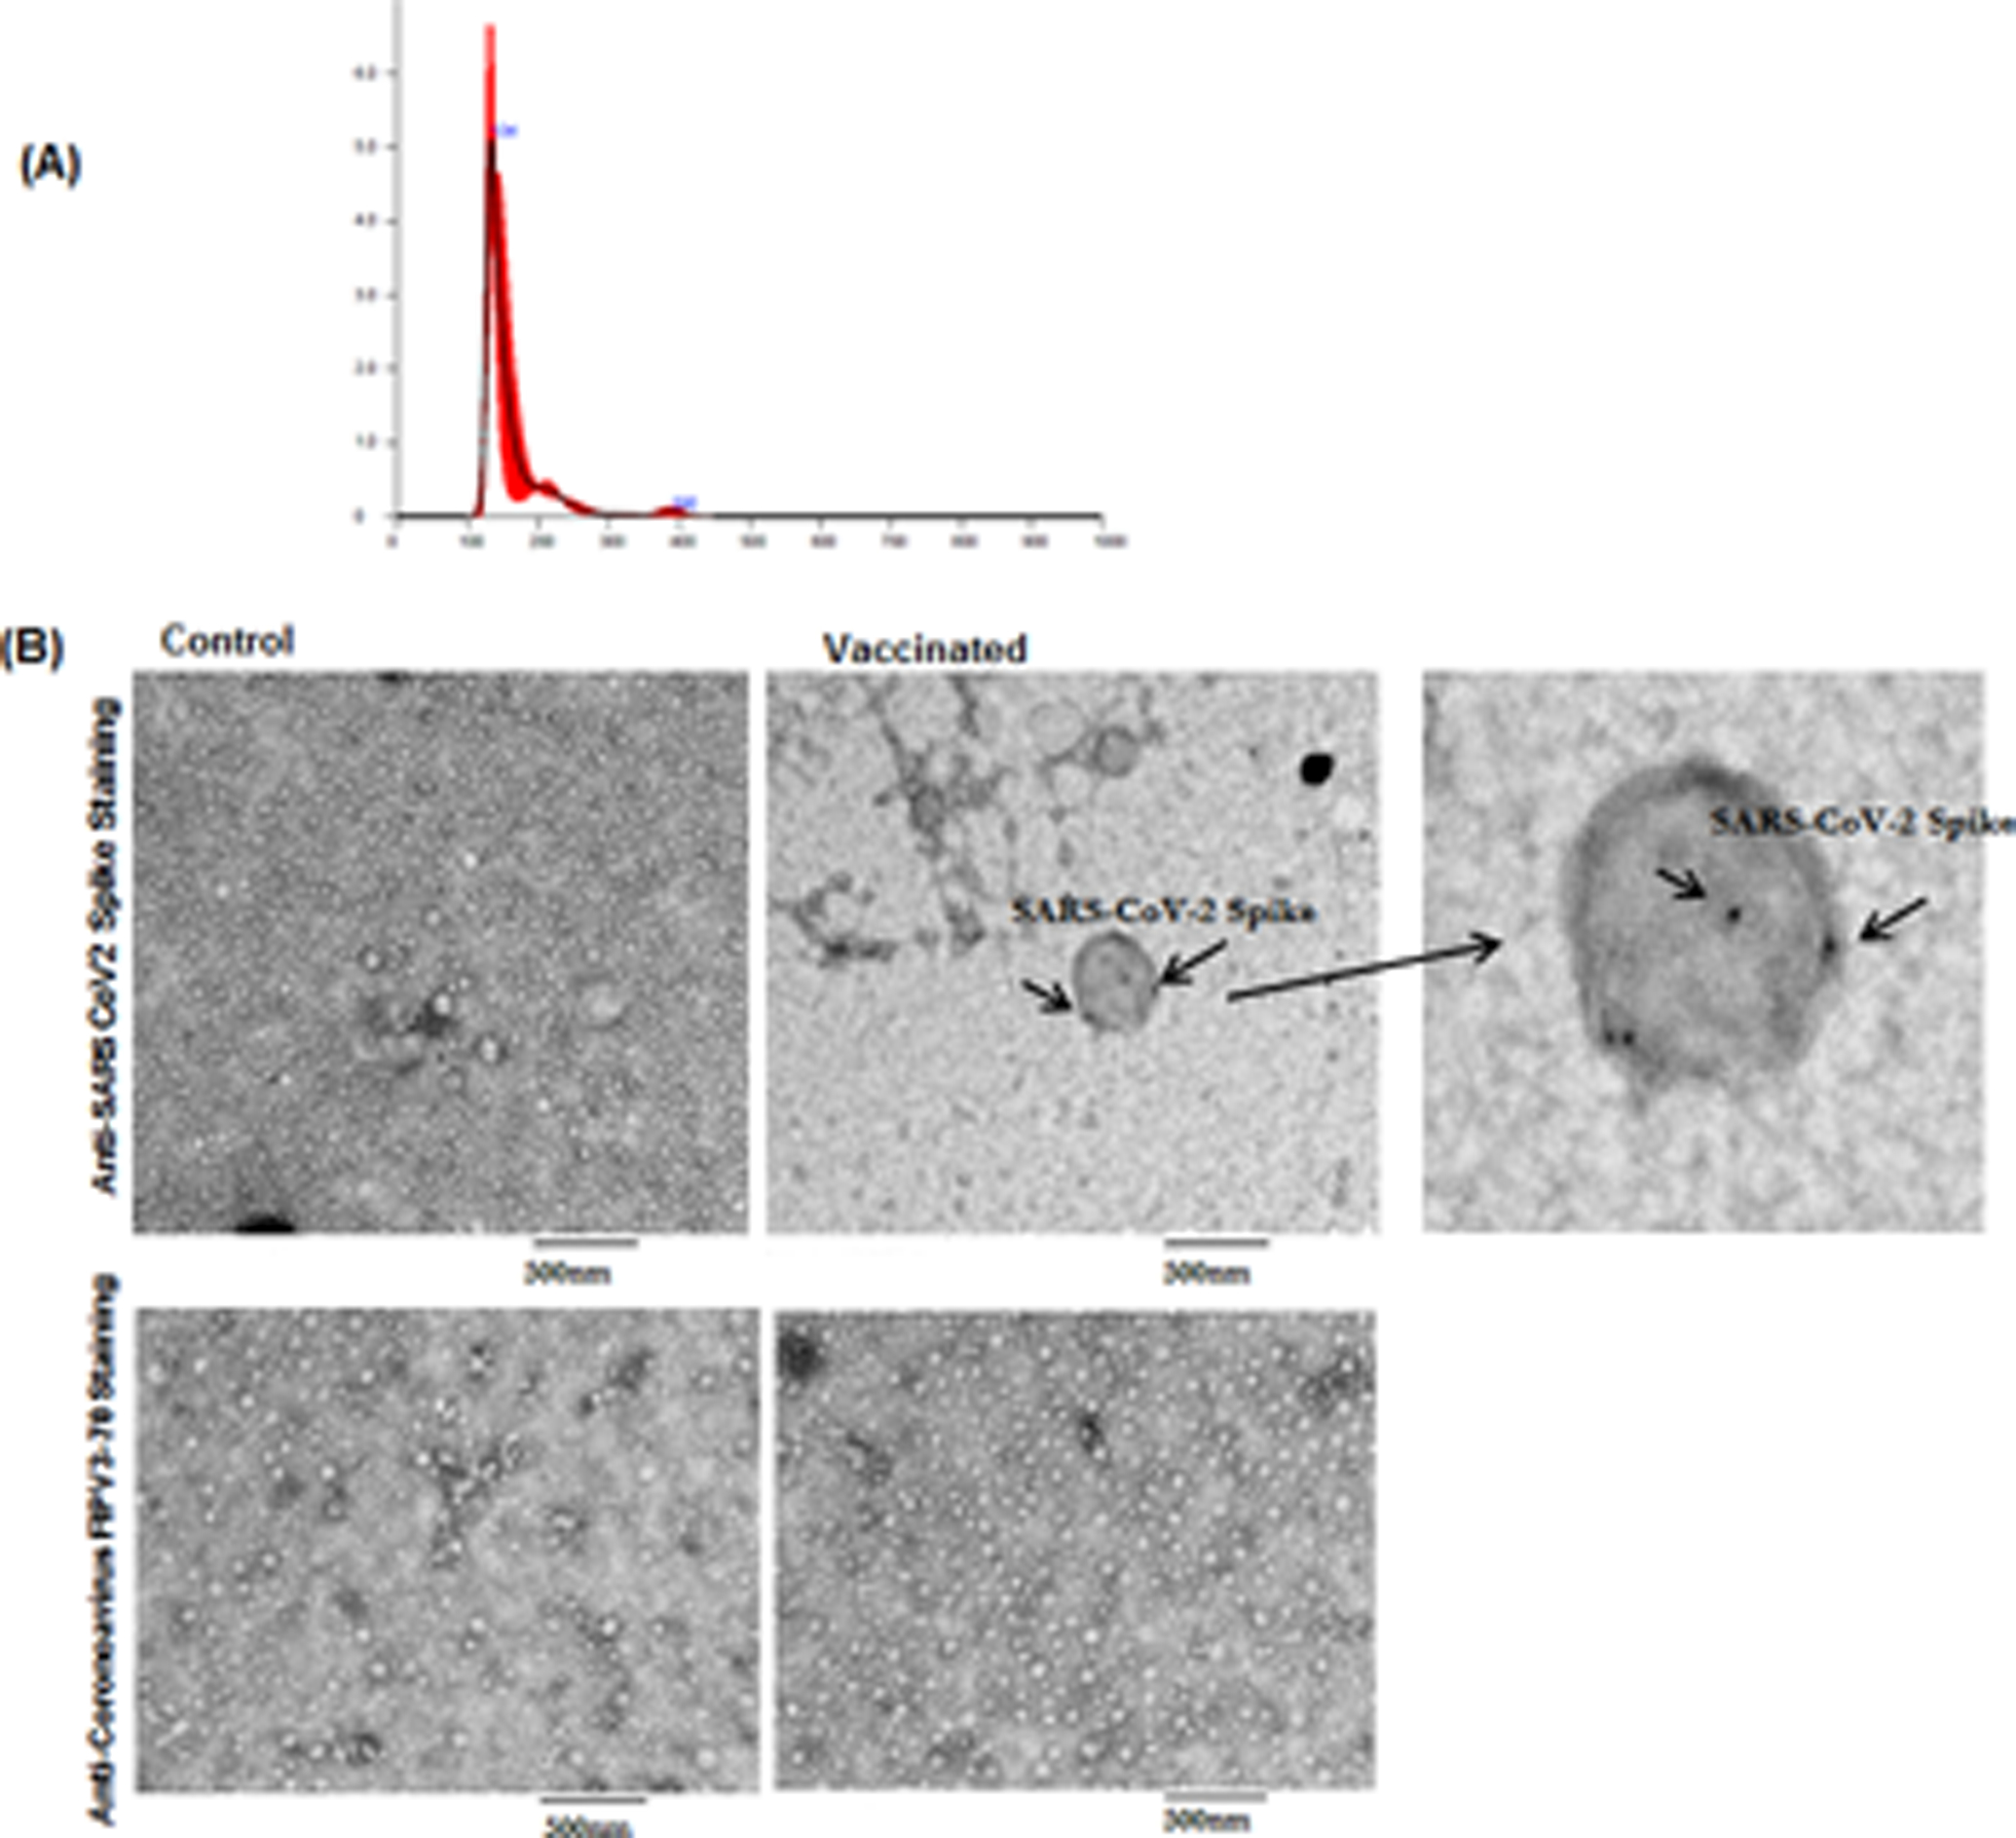
(A) Representative nanosight image for exosomes from vaccinated individuals with mean and median sizes (black thin line in the graph indicates the 3 measurements of the same sample and red line is the average of all 3 lines). (B) Transmission Electron Microscopy Images of SARS-CoV-2 spike antigen on exosomes from control exosomes from control and vaccinated individuals. Arrows indicate SARS-CoV-2 spike positive exosomes. Right side third image is the zoomed image of positive exosome from Vaccinated sample. We have used anti-coronavirus FIPV3-70 Ab as negative control for both the samples.
