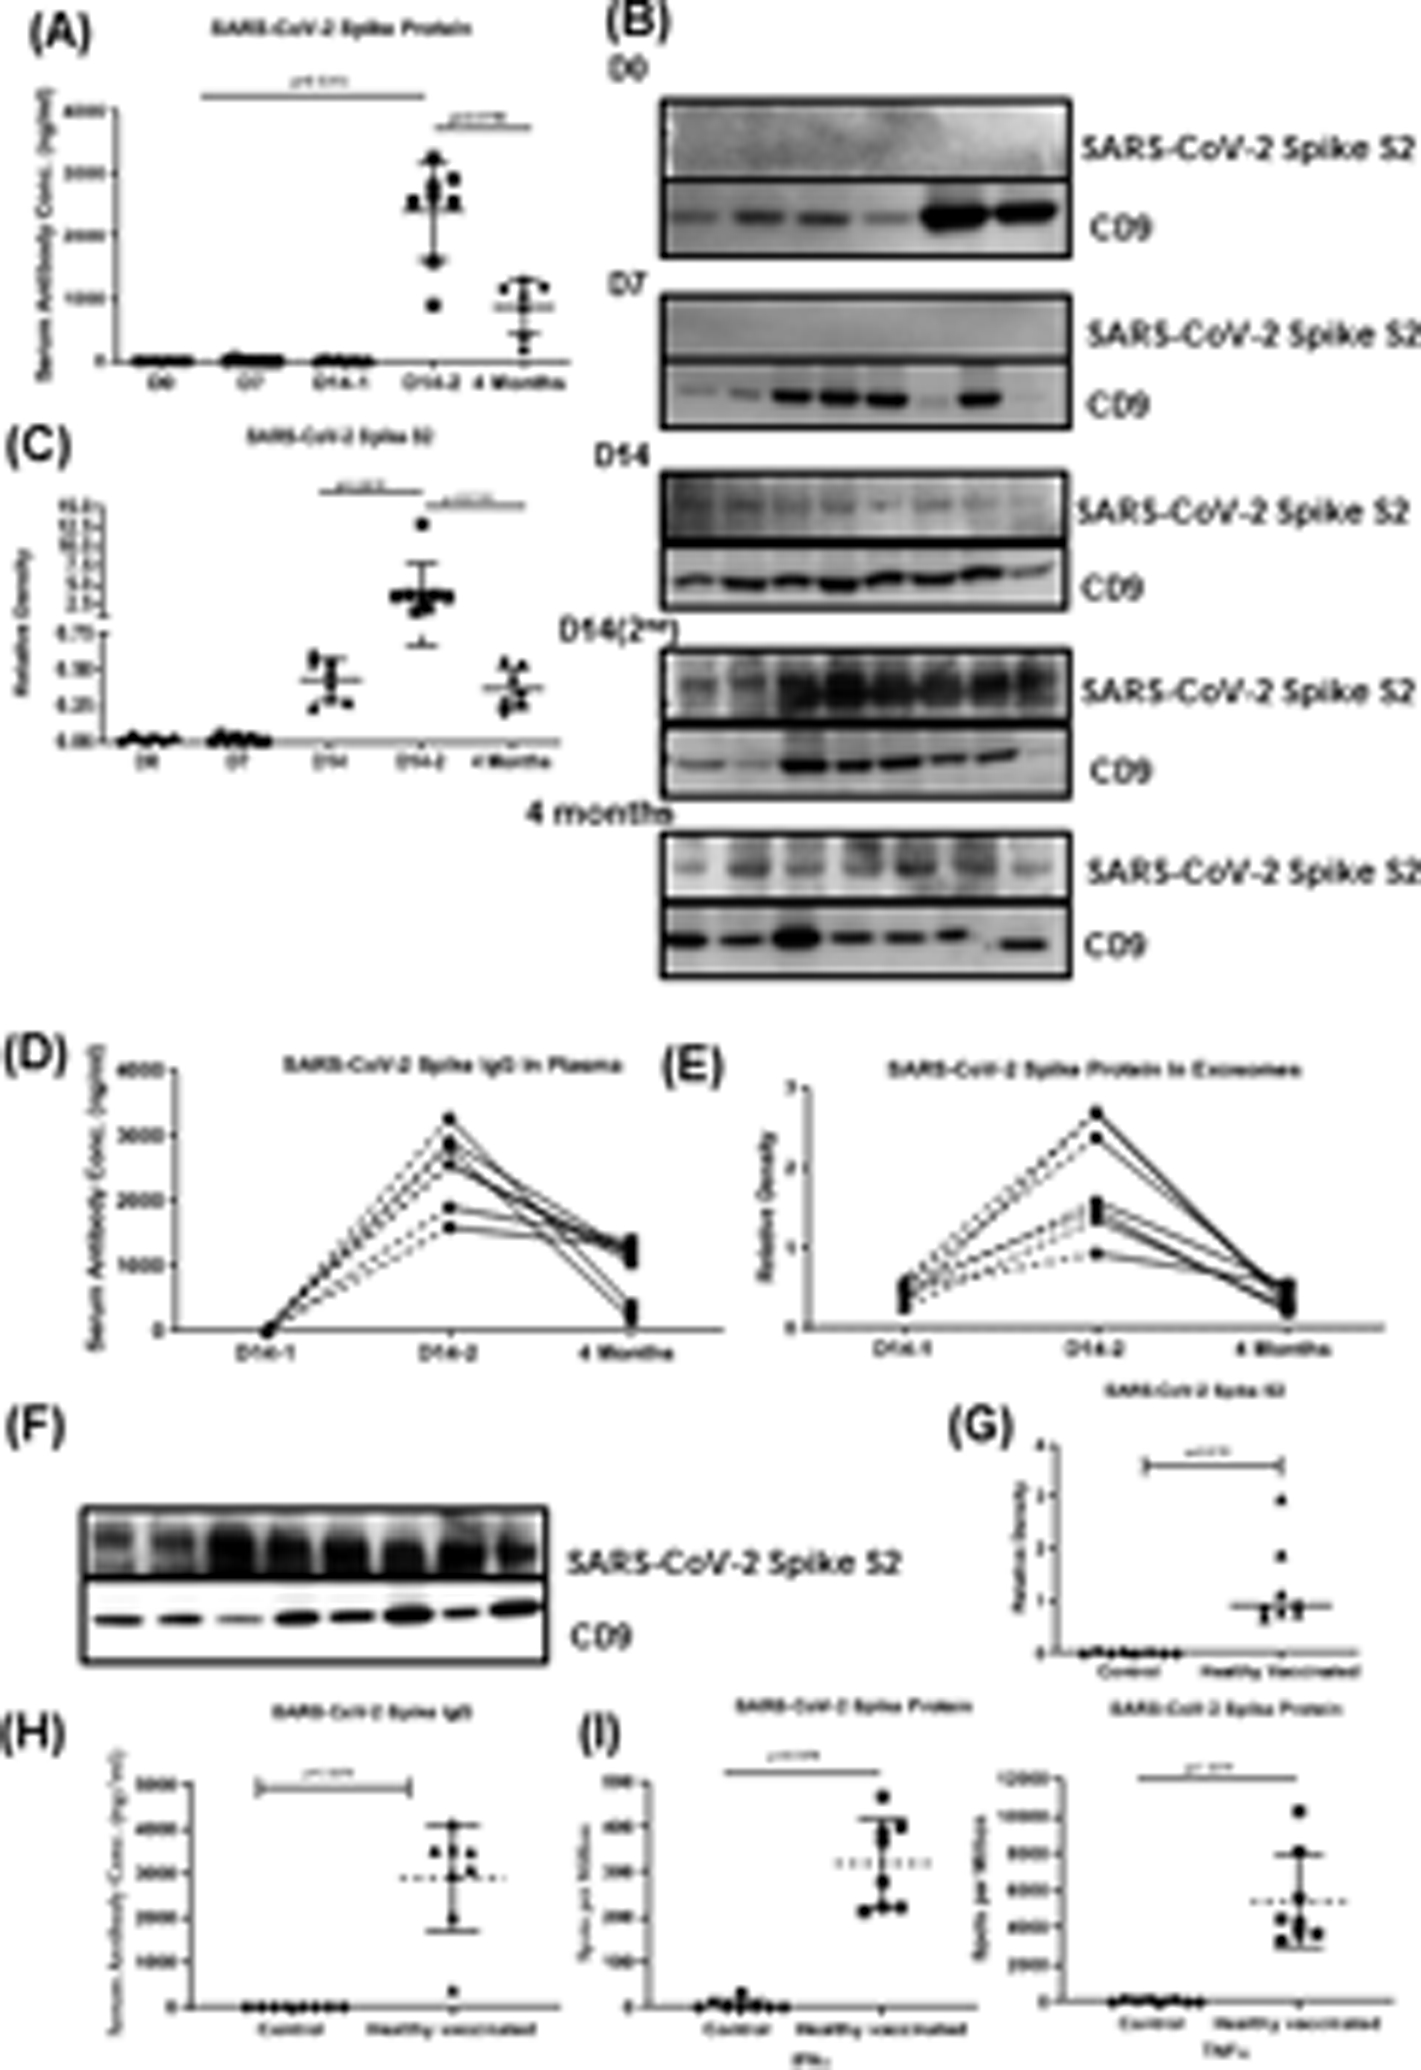
Figure 2:

(A) Levels of SARS-CoV-2 spike Ab in vaccinated healthy individuals at D0, D7 and 14 after first dose of vaccine, D14 after second dose of vaccine and 4 months after second dose of vaccine. (B) Western blot of exosome protein SARS-CoV-2 spike protein S2 at D0, D7 and D14 of first vaccination, D14–2 after second dose of vaccine and 4 months after second dose of vaccine. (C) Densitometry and statistical analysis of western blots. (D) Before and after line plot of levels of SARS-CoV-2 spike Ab in vaccinated healthy individuals at D14–1, D14–2 and 4M after second dose of vaccine (E) Before and after line plot of densitometry of western blots for SARS-CoV-2 spike protein in vaccinated healthy individuals at D14–1, D14–2 and 4M after second dose of vaccine. (F) Western blot of SARS-CoV-2 spike protein S2 in exosomes within 14 days after second dose of vaccine in healthy individuals. (G) Densitometry and statistical analysis of western blots. (H) Levels of SARS-CoV-2 spike Ab in vaccinated healthy individuals at 14 days after second dose of vaccine. (I) EliSPOT for cytokine development (TNFα and IFNγ) in response to SARS-CoV-2 spike protein.
*All graphs are represented as scatter dot plots with mean and SD (vertical bar line). CD9 is used to normalize the all the blots. Western blots and Antibody development experiments were performed at least 3 times independently.
