

Abstract
Background:
Sleep plays an important role in neurodevelopment. However, the effects of prenatal alcohol exposure on sleep quality have been understudied, despite reports of sleep disturbance in infants prenatally exposed to alcohol and elevated levels of sleep problems reported by caregivers of children with fetal alcohol spectrum disorders (FASD). The current study aimed to characterize sleep in children with prenatal alcohol exposure using both objective (actigraphy) and subjective methods (questionnaires, sleep diaries).
Methods:
Participants aged 6-10 years, with and without prenatal alcohol exposure, were included in the study (alcohol-exposed [AE] = 35; control [CON] = 39). Objective sleep was measured via 24-hour actigraphy for two weeks. Parents completed sleep diaries and sleep questionnaires (Children’s Sleep Habits Questionnaire, Pediatric Sleep Questionnaire). Multivariate analysis of variance was used to characterize the sleep profile (objective, subjective) and examine group differences.
Results:
There were no group differences on actigraphy metrics averaged across two weeks; however, the AE group showed significantly greater intraindividual variability on most actigraphy measures, particularly total sleep time, percent sleep, wake after sleep onset, and number of wake bouts. Parents reported significantly more sleep problems in the AE group than in the CON group, primarily driven by night wakings, parasomnias (e.g., sleepwalking), snoring, and daytime sleepiness. These effects were more severe in children > 8.5 years of age.
Conclusions:
Despite similar two-week average sleep outcomes, children with prenatal alcohol exposure showed greater intraindividual sleep variability and parents reported more sleep problems related to sleep behavior and snoring. These difficulties with sleep may be related to other cognitive and behavioral outcomes. Importantly, sleep is a modifiable behavior, and interventions focusing on variability in sleep, particularly sleep duration variability, have the potential to impact quality of life in children with prenatal alcohol exposure and their families.
Keywords: Sleep, prenatal alcohol exposure (PAE), fetal alcohol spectrum disorder (FASD), actigraphy, intraindividual variability
INTRODUCTION
Alcohol exposure during fetal development is one of the leading known causes of neurodevelopmental disorders (American Academy of Pediatrics, 2000). Children with prenatal alcohol exposure (PAE) may have physical abnormalities, behavior challenges, and cognitive difficulties (Mattson et al., 2011, Mattson et al., 2019), although they also may experience strengths in social relationships, resilience, and positive mood state (Kautz-Turnbull et al., 2022). Fetal alcohol spectrum disorders (FASD) is a non-diagnostic term that encompasses the full range of the effects of PAE and is conservatively estimated to affect 11.3 to 50.0 per 1000 children in the United States, although the prevalence may be as high as 98.5 per 1000 children (May et al., 2018). Fetal alcohol syndrome (FAS) is characterized by prenatal-onset growth deficiency, craniofacial dysmorphology, and central nervous system dysfunction (Jones and Smith, 1975). Approximately 6.7 per 1000 individuals meet criteria for FAS (Roozen et al., 2016); however, most people affected by developmental exposure to alcohol do not have the facial abnormalities required for this diagnosis. Nonetheless, exposure to alcohol in utero profoundly affects neurodevelopment and, subsequently, cognitive and behavioral outcomes (Donald et al., 2015). These impairments are associated with adaptive dysfunction, academic difficulties, and psychopathology, which have significant repercussions across the lifespan for the individual, their caregivers, and society at large.
Caregivers of children with FASD commonly report that their child has sleep problems (Wengel et al., 2011, Gerstner et al., 2023), though limited research has characterized these sleep disturbances and their consequences (Ipsiroglu et al., 2013). Prevalence rates for pediatric sleep disorders in the general population are estimated to be between 28 and 36% (Meltzer et al., 2014) and as high as 86% in children with neurodevelopmental disorders, such as autism spectrum disorder (ASD), Down syndrome, and ADHD (Robinson-Shelton and Malow, 2016). Though the rate of sleep problems in children with PAE is largely unknown, a recent study reported that 79% of children with FASD had clinically significant sleep problems (Gerstner et al., 2023). Further, in a clinical sample of children with FASD, it was found that every child had chronic insomnia, 93% had circadian rhythm sleep disorders, and 85% had restless sleep (Ipsiroglu et al., 2019). Additionally, all children showed excessive daytime sleepiness which was associated with hyperactive/hyperkinetic behaviors (Ipsiroglu et al., 2019).
Sleep is critical for healthy development in childhood. It is fundamental to the developmental process as it plays a role in cognition, neuroplasticity, brain maturation, and optimal daytime functioning (Mughal et al., 2020). Sleep is especially important to early neurodevelopment–within the first five years of life, children spend more time asleep than in all waking activities combined (Dahl, 1996). During this time, the sleep-wake cycle pattern changes considerably, with total sleep time decreasing gradually from infancy through childhood, and this emergence of sleep stages in early life may predict brain maturation levels (Inkelis and Thomas, 2018). Consequently, early sleep characteristics are not only critical to neurodevelopment, but may be predictive of later neurobehavioral function. All in all, disrupted or deficient sleep has the potential to impact every aspect of functioning for a child (Meltzer et al., 2014).
Unfortunately, even though sleep is critical for early neurodevelopment (Mughal et al., 2020), sleep disorders often go undiagnosed and untreated in children with FASD (Ipsiroglu et al., 2013). Most published studies have described sleep and circadian disturbances in infants with FASD, demonstrating that those exposed to alcohol prenatally exhibit more sleep problems, disrupted sleep state cycle length, and abnormal EEG patterns (Inkelis and Thomas, 2018, Scher et al., 2000). PAE can disrupt fetal sleep-wake cycles and breathing movements as early as week 37 of gestation (Mulder et al., 1998), and is also associated with sleep fragmentation (i.e., brief awakenings that occur during sleep) in infants (Troese et al., 2008).
Although data are limited, caregivers of children with FASD also report sleep problems beyond infancy (Wengel et al., 2011), including problems with falling asleep, sleep duration, night wakings, nightmares, bedtime resistance, sleep anxiety, and parasomnias (i.e., bedwetting, sleep talking, night terrors) (Rzepecka et al., 2011), compared to controls (Chen et al., 2012, Wengel et al., 2011, Mughal et al., 2021, Gerstner et al., 2023). Objective data obtained from limited (n = 5, n = 19, and n = 36, respectively; (Chen et al., 2012, Dylag et al., 2021, Goril et al., 2016) polysomnography studies indicate children with FASD have increased sleep fragmentation, mild sleep disordered breathing and greater frequency of central apneic events, and abnormal melatonin secretion. PAE is also associated with significantly longer sleep onset latency and shorter sleep duration, as measured by actigraphy (Wengel et al., 2011, Pesonen et al., 2009). Moreover, animal models show that alcohol exposure in utero disrupts sleep-wake behavior and negatively affects circadian rhythm (Wengel et al., 2011, Earnest et al., 2001, Sakata-Haga et al., 2006, Hilakivi, 1986), suggesting that altered circadian rhythmicity and sleep disruption may be a primary consequence of developmental alcohol exposure.
In addition, it is possible that sleep problems may contribute to or exacerbate the effects of PAE on cognition, behavior, and health. Sleep difficulties are related to neurobehavioral difficulties that are consistent with dysfunction of the prefrontal cortex, as well as hyperactive behaviors and mood disturbances (Kheirandish and Gozal, 2006, Gozal et al., 2004), all of which are also prevalent in children with FASD. Moreover, lack of sleep is also associated with obesity, cardiovascular disease, stress, and inflammation (Mullington et al., 2009). As noted, in children with neurodevelopmental disabilities, the effects of sleep disruption are more severe (Ingrassia and Turk, 2005), suggesting that sleep disturbance may exacerbate behavioral problems. Furthermore, the effectiveness of interventions delivered to individuals with FASD may be markedly reduced when sleep disturbance is present (Jan et al., 2010). Thus, elucidating the characteristics of sleep problems in children with PAE may be critically important to further understanding factors that influence executive functioning, attention, and other behavioral challenges in FASD, as well as identifying effective treatment options.
Study Aims
This study aimed to identify patterns of sleep disturbance in children with PAE using both objective (actigraphy) and subjective measures (questionnaires, sleep diaries) of sleep. We hypothesized that children with PAE would demonstrate greater objective sleep disturbance (i.e., less total sleep time, more sleep fragmentation) and that subjective caregiver-reported data would show more problems with bedtime resistance, sleep duration, sleep anxiety, night awakenings, parasomnias, sleepiness, and behavior than controls.
In addition, it is unclear how age affects sleep patterns in children with FASD, as most studies have focused on sleep problems at a particular time point or averaged sleep problems across birth to early adolescence (Chandler-Mather et al., 2021). Chandler-Mather et al. (2021; n = 3447) found that in children ages 2 to 9 years old, heavy PAE was related to increased probability of parent-reported sleep problems in 2–3-year-olds and 6–7-year-olds. However, other studies have found no significant relationship between sleep disturbances and age in children with FASD (Gerstner et al., 2023, Mughal et al., 2020). Meanwhile, sleep problems for typically developing children have been found to diminish with age, yet this developmental trajectory may not be the same for children with neurodevelopmental disorders (Gregory and O’Connor, 2002, Sivertsen et al., 2012, Richdale and Prior, 1995). Thus, this study also examined relationships between age and sleep quality. We hypothesized that there would be age-related changes in both objective (actigraphy) and subjective (questionnaire) measures of sleep in children with PAE.
MATERIALS AND METHODS
All study procedures were approved by the institutional review boards at San Diego State University and University of California, San Diego. Parents or guardians provided written informed consent and children 7 years or older provided oral or written assent. Participants were provided monetary incentives for study completion commensurate with the amount of time required to complete the study.
Participants
Two groups of children were recruited and assessed: children with histories of heavy PAE (AE; n = 35) and controls without PAE (CON; n = 39). Children aged 6-10 years were selected based on the inclusion and exclusion criteria listed below. One subject was consented and enrolled in the study at age 10 but turned 11 during sleep actigraphy collection.
AE group.
Children in the AE group had a history of heavy PAE (≥4 drinks per occasion at least once per week, or ≥14 drinks per week). Information regarding PAE was obtained from medical, legal, or social service records, or maternal report, if available. Children in this group received a dysmorphology exam by an expert dysmorphologist to determine alcohol-related diagnoses using standard criteria (Jones et al., 2006). To meet criteria for FAS, individuals had three cardinal facial dysmorphology markers (i.e., short palpebral fissures, smooth philtrum, thin vermilion); for partial FAS, individuals had 2 of 3 facial features, confirmation of PAE, and impairment on neurobehavioral testing; for alcohol-related neurodevelopmental disorder (ARND), children had confirmed PAE and impairment on neurobehavioral testing; for PAE, children had confirmed PAE, and either had not completed neurobehavioral testing or results did not meet ARND criteria. Children in this group were identified retrospectively; thus, information concerning the exact amounts and timing of PAE was unavailable. Subjects for the AE group were recruited from the UC San Diego FASD Research Registry and the San Diego State University Center for Behavioral Teratology.
CON group.
Children in the CON group had minimal (<1 drink per week and never >2 drinks per occasion) or no history of PAE. Subjects for the CON group were recruited from the UC San Diego MotherToBaby research study and the SDSU Center for Behavioral Teratology. In order to create a heterogeneous control group that is a better comparison group for this study, we did not exclude from the CON group children with ADHD, learning disorders, developmental disabilities, behavioral problems, or sleep disorders.
Exclusion Criteria.
Children were excluded from both groups if they had had a serious head injury with loss of consciousness for more than 30 minutes; significant physical (e.g., uncorrected vision impairment, hemiparesis) or psychiatric (e.g., active psychosis) disability that would preclude participation in the study; or other known cause of intellectual disability (e.g., chromosomal abnormalities, congenital hypothyroidism, neurofibromatosis). Children were excluded from the CON group if greater than minimal PAE was suspected or unconfirmed, or if they had a history of seizure disorder.
Sleep Assessment
Actigraphy.
Actigraphy is a validated tool to detect sleep and wake states for extended periods of time in a child’s natural environment (Van de Water et al., 2011, Meltzer et al., 2012) and is a recommended method for detecting sleep quantity and circadian patterns in children, as a non-invasive alternative to the gold-standard of polysomnography (Meltzer et al., 2012). This technology uses a small accelerometer, generally in the form of a wristband, to detect movement. Subjects wore an Actiwatch-2 (Philips Respironics Inc., Pittsburgh, Pennsylvania) over a two-week period to obtain objective sleep measures. Two weeks of actigraphy data were collected to maximize the number of usable nights (both weekday and weekend), while minimizing participant burden. Sleep diaries were used to corroborate and score actigraphy data. If it was noted that the watch was removed, the night was excluded from analysis. Watches were worn during the day and at night, including school days.
Variables obtained from actigraphy included total sleep time, percent of time spent asleep, wake after sleep onset (WASO), number of nocturnal awakenings (wake bouts), and fragmentation index. Measures were averaged across nights. Night-to-night variability in these sleep metrics was calculated by obtaining the standard deviation of each variable across two-weeks within each subject.
Children’s Sleep Habits Questionnaire (CSHQ).
The CSHQ is a validated, retrospective, 45-item caregiver-report questionnaire that assesses sleep behaviors (i.e., bedtime resistance, sleep onset, sleep duration, anxiety around sleep, behaviors during sleep and night wakings, sleep-disordered breathing, parasomnias, morning waking/daytime sleepiness) in children aged 4 to 10 (Owens et al., 2000a). A Total Score ≥ 41 was considered a positive screen for sleep problems.
Pediatric Sleep Questionnaire (PSQ).
The PSQ is a validated 22-item caregiver-report questionnaire used to investigate the presence of sleep-related breathing disorders in children aged 2 to 18, including symptoms such as snoring, daytime sleepiness, and behavioral disturbances (Chervin et al., 2000). A Total Score of ≥ 8 was considered a positive screen for a sleep-related breathing disorder.
Sleep Diary.
Parents completed a sleep diary for their child each morning and evening (Morgenthaler et al., 2007) to further aid in the scoring of actigraphy. Variables collected from the sleep diary included time the child got into bed, lights out time, sleep onset latency (minutes to fall asleep), number of awakenings after first falling asleep, morning wake-up time, and time the child got out of bed. Additional information collected from the sleep diary included number of daytime naps, medications taken, whether the child experienced any illness, and whether the actigraph was taken off at any point.
Study Logistics
Participants completed two visits, two weeks apart. At the first visit, participants were shown how to wear the actigraph and fill out the sleep diary. During the second visit, caregivers completed questionnaires about the participant’s sleep and behavior. Medication use was recorded in the sleep diary. Some children in the PAE group were taking medications relevant to sleep (e.g., melatonin); participants were not asked to alter any medication regimen for the purpose of the study. Data were collected between 2017 and 2022.
General Statistical Analyses
SPSS statistical software version 29 was used for the primary analyses. Demographic data were analyzed using ANOVA (for continuous variables) or chi-square (for categorical variables) to examine group differences in age, sex, race, ethnicity handedness, parent education, and household income. Data were inspected for violations of assumptions of normality, homogeneity of variance, and linearity prior to analysis. To determine statistical significance, an alpha level of p<.05 (two-tailed) was used.
Dependent variables were expected to be correlated; therefore, multivariate analysis of variance (MANOVA) was used to address the central hypotheses. MANOVAs were performed separately for objective (actigraphy) and subjective (questionnaire) sleep measures as the dependent variables, and with group (AE, CON) and sex (male, female) as the between-subjects factors (see Table 1). There was no significant effect of sex on sleep measures, so it was removed from the final model for parsimony. Data collection occurred prior to and during the COVID-19 pandemic; therefore, COVID-related differences in sleep outcomes were examined. Homogeneity assumptions were evaluated at an alpha level of .001 using Box’s M test of homogeneity of covariance and Levene’s homogeneity test. Wilk’s criterion (Λ) was used as the omnibus test statistic. A significant omnibus multivariate effect was followed-up by using univariate ANOVAs to examine the main effect for each dependent variable. Results from these analyses were used to examine the extent to which there were group differences on each sleep variable. Multiple regression modeling was used to predict sleep outcomes as a function of group, age, and their interaction. Significant effects were followed up using univariate analysis of variance to examine effects of age when split at the midpoint to explore whether results were differentially observed in the older or younger halves of our sample.
Table 1.
Measures included in objective (actigraphy) and subjective (questionnaire) MANOVAs.
| Objective (Actigraphy) | Subjective (Questionnaires) |
|---|---|
| Average | CSHQ |
| WASO (minutes) | Bedtime Resistance |
| # Wake Bouts | Sleep Onset Delay |
| Sleep Time (minutes) | Sleep Duration |
| % Sleep | Sleep Anxiety |
| Fragmentation Index | Night Wakings |
| Variability (Within-person SD) | Parasomnias |
| WASO (minutes) | Sleep Disordered Breathing |
| # Wake Bouts | PSQ |
| Sleep Time (minutes) | Snoring |
| % Sleep | Sleepiness |
| Fragmentation Index | Behavior |
WASO = Wake after sleep onset
RESULTS
Demographic Data
Groups did not significantly differ on age, sex, race, ethnicity, or handedness. Groups differed significantly on parental education such that the CON group had higher parental education level than the AE group. Children in the AE group were also more likely to have an anxiety diagnosis and use melatonin, stimulants, antidepressants, and antipsychotic medications. Eight children in the CON group had ≥1 of the following reported by parents: depression, anxiety, ADHD, sleep disorder, stimulant use. The rate of ADHD in the CON group (12.8%) was similar to recently reported prevalence rates in the United States general population (12.9%; (Zgodic et al., 2023). See Table 2 for demographic characteristics by group. Significantly more children in the AE group also had an ADHD diagnosis. However, given the high rates of ADHD in individuals with PAE, covarying for ADHD-status could limit the ability to detect significant effects of group on sleep disturbance by reducing the variance accounted for by PAE, and further limiting power. Due to these limitations, ADHD was not included as a covariate in our analyses (see Supplementary Materials for exploratory examination of group differences related to ADHD).
Table 2.
Demographic information by group. Groups included children with heavy prenatal alcohol exposure (AE) and non-exposed controls (CON).
| Demographic Variable | AE n = 35) |
CON (n = 39) |
p |
|---|---|---|---|
|
| |||
| Age in Years [M (SD)] | 8.8 (1.65) | 8.0 (1.57) | .149 |
| Sex [n (% Female)] | 17 (48.6) | 21 (53.8) | .65 |
| Race [n (% White)] | 19 (54.3) | 29 (74.4) | .071 |
| Ethnicity [n (% Hispanic)] | 13 (37.1) | 12 (30.8) | .306 |
| Handedness [n (% Right)] | 28 (80.0) | 33 (84.6) | .602 |
| FASD Diagnosis [n (%)] | 25 (71.4) | -- | |
| FAS | 2 (5.7) | -- | |
| Partial FAS | 5 (14.2) | -- | |
| ARND | 18 (51.4) | -- | |
| PAE (no formal FASD diagnosis) | 10 (28.6) | -- | |
| Caregiver Relationship [n (%)] | -- | -- | |
| Biological Parent | 0 (0.0) | 39 (100.0) | |
| Adoptive Parent | 34 (97.1) | 0 (0.0) | |
| Foster Parent | 1 (2.9) | 0 (0.0) | |
| Parent Education [n (%)]* | -- | -- | .002 |
| Partial High School | 0 (0) | 1 (2.6) | |
| High School Graduate | 8 (22.9) | 2 (5.1) | |
| Partial College | 7 (20.0) | 2 (5.1) | |
| Standard College/University | 12 (34.3) | 10 (25.6) | |
| Graduate/Professional Training | 7 (20.0) | 24 (61.5) | |
| Family Income [n (%)] | -- | -- | .336 |
| $10,001-20,000 | 1 (2.9) | 2 (5.1) | |
| $20,001-30,000 | 3 (8.6) | 2 (5.1) | |
| $30,001-50,000 | 3 (8.6) | 1 (2.6) | |
| $50,001-75,000 | 5 (14.3) | 5 (12.8) | |
| $75,001-100,000 | 6 (17.1) | 2 (5.1) | |
| $100,000+ | 16 (45.7) | 26 (66.7) | |
| Psychiatric Diagnoses (Parent-Reported [n (%)]) | -- | -- | |
| Depression | 2 (5.7) | 1 (2.6) | .459 |
| Anxiety* | 11 (31.4) | 5 (12.8) | .037 |
| ADHD* | 15 (42.9) | 5 (12.8) | .002 |
| Sleep Disorder Diagnosis [n (%)] | 5 (14.3) | 1 (2.5) | .054 |
| Medication Use [n (%)] | -- | -- | |
| Melatonin* | 8 (22.9) | 0 (0.0) | <.001 |
| Stimulant* | 15 (42.9) | 2 (5.1) | <.001 |
| Antidepressant* | 6 (17.1) | 0 (0.0) | .005 |
| Antipsychotic* | 5 (14.2) | 0 (0.0) | .012 |
| Participated during COVID [n (%)] | 24 (68.6) | 27 (69.2) | 0.951 |
Note:
p < .05 level
Sleep Outcome
Group outcomes on all sleep variables are presented in Table 3. Correlations for measures used in MANOVA analyses are presented in Supplementary Table 2 and Supplementary Table 3.
Table 3.
Group outcomes on objective (actigraphy) and subjective (parent-questionnaire) sleep variables.
| AE (n = 33) |
CON (n = 37) |
p | |
|---|---|---|---|
| Actigraphy Measures | |||
| 2-Week Average | |||
| WASO | 73 (19.88) | 70.7 (22.09) | .653 |
| # Wake Bouts | 31.1 (6.28) | 32.8 (6.31) | .26 |
| Sleep Time | 491 (45) | 480.5 (29.73) | .248 |
| % Sleep | 87.1 (3.75) | 87.2 (3.88) | .887 |
| Fragmentation Index | 32.2 (7.08) | 30.6 (6.89) | .326 |
| Variability (Within-person SD) | |||
| WASO* | 24.1 (13.05) | 16.3 (5.78) | .002 |
| # Wake Bouts* | 6.8 (2.37) | 5.6 (1.35) | .012 |
| Sleep Time* | 54 (24.22) | 38.6 (13.85) | .002 |
| % Sleep* | 3.7 (2.04) | 2.7 (1.01) | .008 |
| Fragmentation Index* | 8.5 (3.19) | 7.2 (2.12) | .05 |
|
| |||
| AE (n = 34) |
CON (n = 38) |
p | |
|
| |||
| Sleep Questionnaires | |||
| CSHQ | |||
| Total Score* | 50.3 (10.44) | 45 (7.5) | .015 |
| Bedtime Resistance | 8.5 (2.77) | 8.6 (2.84) | .906 |
| Sleep Onset Delay* | 1.8 (0.67) | 1.5 (0.72) | .026 |
| Sleep Duration | 4.4 (1.91) | 4.2 (1.41) | .569 |
| Sleep Anxiety | 6.4 (2.51) | 6 (2) | .386 |
| Night Wakings* | 4.8 (1.62) | 4.1 (1.32) | .036 |
| Parasomnias* | 10.2 (3.11) | 8.3 (1.45) | .001 |
| Sleep Disordered Breathing | 3.4 (1.23) | 3.2 (0.61) | .455 |
| Daytime Sleepiness | 13.8 (3.23) | 12.3 (3.14) | .058 |
| PSQa | |||
| Total Score* | 7.8 (3.9) | 3.4 (3.16) | <.001 |
| Snoring* | 0.7 (1.18) | 0.1 (0.29) | .009 |
| Sleepiness* | 1.2 (1.39) | 0.6 (0.74) | .025 |
| Behavior* | 4.5 (1.66) | 2.2 (2.15) | <.001 |
AE = prenatal alcohol exposure, CON = control, WASO = wake after sleep onset, SD = standard deviation, CSHQ = Children’s Sleep Habits Questionnaire, PSQ = Pediatric Sleep Questionnaire.
Note:
p < .05 level
PSQ scores were available for n = 34 in the CON group
Actigraphy
Actigraphy was generally well tolerated by participants; four children (2 AE and 2 CON) refused to wear the Actiwatch-2. On average, the CON group had 12.27 usable nights (range: 6-15, SD 2.62) and the AE group had 13.21 usable nights (range 6-14, SD 1.85). There were no significant group differences observed on mean-based sleep actigraphy metrics, averaged across two weeks (Figure 1, Table 3). However, AE demonstrated significantly greater levels of night-to-night variability in wake after sleep onset (WASO), number of wake bouts, sleep time, and percent sleep, relative to CON. Of note, there were no significant differences between pre-COVID and COVID outcomes and no group by COVID interactions, so these data were combined for all analyses (see Supplementary Table 1).
Figure 1.

Distribution of sleep actigraphy measures (two-week average [left panel] and night-to-night variability [SD; right panel]) by group. The AE group showed significantly greater intraindividual variability in WASO, number of wake bouts, sleep time, percent sleep, and fragmentation index than the CON group. Note: ** p < .01, * p < .05. WASO = wake after sleep onset, SD = standard deviation.
A between-subjects MANOVA was performed on ten dependent sleep actigraphy variables: the average and night-to-night variability (SD) scores for the five distinct sleep actigraphy metrics. See Supplementary Table 2 for intercorrelations among MANOVA dependent variables. Using an alpha level of .001 to evaluate homogeneity assumptions, Box’s M test of homogeneity of covariance was statistically significant (p<.001), and Levene’s homogeneity test was not statistically significant (all ps>.001). MANOVA results are presented in Table 4. Using Wilk’s criterion (Λ) as the omnibus test statistic, the combined dependent variables resulted in a significant main effect for group (F[10, 59]=3.984, p<.001, partial η2=.403). There was no significant omnibus effect of COVID when included as a factor in the model.
Table 4.
MANOVA results for sleep profile by group.
| Sleep Variable | Group [F (df)] | p | Partial η2 |
|---|---|---|---|
| Omnibus* | 3.984 (10, 59) | <.001 | 0.403 |
| Average | |||
| WASO | 0.203 (1, 59) | 0.653 | 0.003 |
| # Wake Bouts | 1.288 (1, 59) | 0.26 | 0.019 |
| Sleep Time | 1.358 (1, 59) | 0.248 | 0.02 |
| %Sleep | 0.02 (1, 59) | 0.887 | 0 |
| Fragmentation Index | 0.977 (1, 59) | 0.326 | 0.014 |
| Variability | |||
| WASO* | 10.825 (1, 59) | 0.002 | 0.137 |
| # Wake Bouts* | 6.6 (1, 59) | 0.012 | 0.088 |
| Sleep Time* | 10.916 (1, 59) | 0.002 | 0.138 |
| %Sleep* | 7.523 (1, 59) | 0.008 | 0.1 |
| Fragmentation Index* | 3.97 (1, 59) | 0.05 | 0.055 |
Note:
p < .05 level,
df = degrees of freedom, WASO = wake after sleep onset. Average sleep metrics were calculated across total days of actigraphy. Variability sleep metrics were calculated from standard deviations for each metric, across total days of actigraphy.
To probe the statistically significant multivariate effects of group, univariate one-way ANOVAs were conducted on each individual dependent variable (Table 4). There were statistically significant main effects of group on WASO variability, number of wake bouts variability, sleep time variability, percent sleep variability, and fragmentation index variability, as AE had more variability in these metrics than CON. There were no statistically significant main effects of group for the average sleep actigraphy metrics.
To determine the effect of age on sleep quality, multiple regression modeling was conducted. (Faul et al., 2007)There was a significant group by age interaction on sleep time variability (F[1, 69]=4.496, p=.038; Figure 2A) and number of wake bouts variability (F[1, 69]=4.105, p=.047; Figure 2B). Variability (SD) of sleep time and number of wake bouts variability increased with age in AE, but there was no significant relationship with age observed in CON. There was no significant group by age interaction for percent sleep variability (F[1, 69]=2.200, p=.143) and WASO variability (F[1, 69]=2.109, p=.151).
Figure 2.
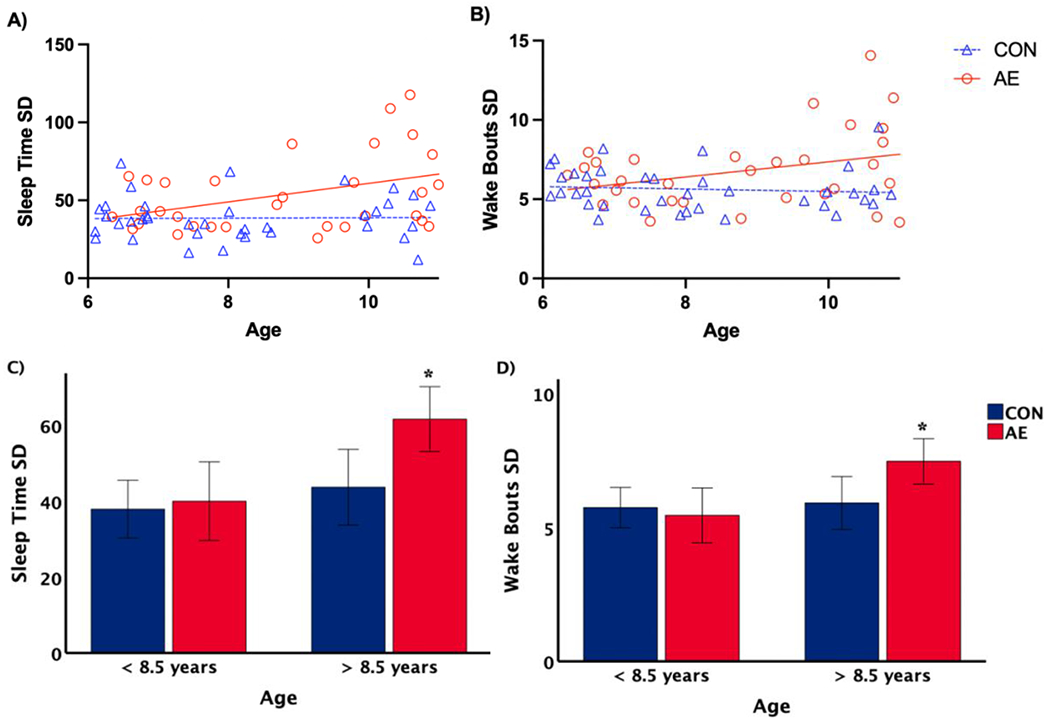
Multiple regression modeling [A and B] and univariate analysis of variance [C and D] results for group by age interaction. Sleep time variability (Sleep Time SD) and number of wake bouts variability (Wake Bouts SD) increased with age in children with AE (ps <.05), but not in controls. There were no significant group differences among the children less than 8.5 years of age, but in children greater than 8.5 years old, sleep time variability and wake bouts variability were significantly higher in children with AE compared to controls (ps < .05, with SEM error bar).
To further probe the effect of age, age was split at the mid-point (8.5 years old). A univariate ANOVA revealed there were no significant group differences in sleep variability for children less than 8.5 years old. However, in children greater than 8.5 years old, sleep time variability (F[1,31]=6.677, p=.015) and wake bouts variability (F[1,31]=5.648, p=.024) were significantly higher in AE compared to CON (see Figure 2C and 2D).
Sleep Diaries
Time in bed recorded in the sleep diary was significantly correlated with time in bed as measured by actigraphy (r=.721, p<.001; see Figure 3). There were no significant group differences on sleep diary measures. In the overall sample, average sleep diary time in bed was 47 minutes longer (p<.001) than the average actigraphy time in bed (see Table 5). Average sleep diary bedtime (i.e., “lights out” time) was 32 minutes earlier (p<.001) than average actigraphy bedtime (i.e., start time of the rest period). Similarly, average sleep diary bedtime was earlier than actigraphy bedtime (p<.001). Average sleep diary wake time (i.e., time of final awakening) was also significantly later (p<.001) than the average actigraphy wake time (i.e., end time of the rest period) across the sample and within each group.
Figure 3.
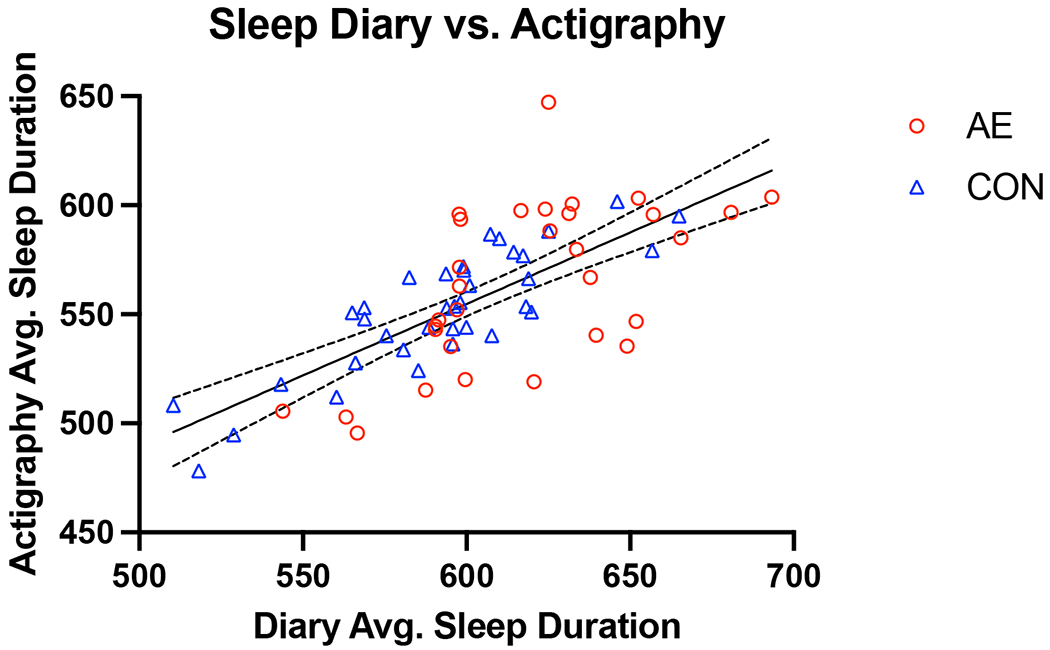
Association between average sleep duration as measured by actigraphy and sleep diaries (in minutes; r = 0.72).
Table 5.
Average bedtime, wake time, and sleep period duration as measured by actigraphy and sleep diaries.
| AE |
CON |
|||
|---|---|---|---|---|
| Variable (Mean [SD]) | Actigraphya | Sleep Diaryb | Actigraphya | Sleep Diaryb |
| Average Bedtime (hh:mm, min) |
9:15:00 PM (41.2) |
8:40:00 PM (40.4) |
9:25:00 PM (49.5) |
8:53:00 PM (50.6) |
| Average Wake Time (hh:mm, min) |
6:41:00 AM (34.6) |
7:00:00 AM (39.4) |
6:37:00 AM (52.4) |
6:49:00 AM (47.9) |
| Average Sleep Duration (min) |
564 (36.6) |
618 (34.4) |
552 (27.6) |
592 (34.0) |
AE: n = 33, CON: n = 37
AE: n = 31; CON: n = 36
Sleep Questionnaires
A between-subjects MANOVA was performed on the 11 dependent sleep questionnaire variables: subscales from the CSHQ (Bedtime Resistance, Sleep Onset Delay, Sleep Duration, Anxiety, Night Wakings, Parasomnias, Sleep Disordered Breathing, Daytime Sleepiness) and PSQ (Snoring, Sleepiness, Behavior). See Supplementary Table 3 for intercorrelations among MANOVA dependent variables. Using an alpha level of .001 to evaluate homogeneity assumptions, Box’s M test of homogeneity of covariance (p<.001) was significant. Levene’s homogeneity test was significant for PSQ Snoring and Sleepiness (ps<.001); all other variables were not statistically significant (ps>.001). MANOVA results are presented in Table 6. Using Wilk’s criterion (Λ) as the omnibus test statistic, there was a significant main effect for group using the combined dependent variables (F[11, 56]=4.02, p<.001, partial η2=0.441). There was no significant omnibus effect of COVID when included as a factor in the model.
Table 6.
MANOVA results for parent-reported sleep questionnaire profile by group.
| Questionnaire Variable | Group [F (df)] | p | Partial η2 |
|---|---|---|---|
| Omnibus* | 4.02 (11, 56) | <.001 | 0.441 |
| CSHQ | |||
| Bedtime Resistance | 0.13 (1, 66) | 0.719 | 0.002 |
| Sleep Onset Delay# | 3.512 (1, 66) | 0.065 | 0.051 |
| Sleep Duration | 0.082 (1, 66) | 0.775 | 0.001 |
| Sleep Anxiety | 0.475 (1, 66) | 0.493 | 0.007 |
| Night Wakings* | 6.678 (1, 66) | 0.012 | 0.092 |
| Parasomnias* | 10.473 (1, 66) | 0.002 | 0.137 |
| Sleep Disordered Breathing | 1.123 (1, 66) | 0.293 | 0.017 |
| Daytime Sleepiness# | 3.858 (1, 66) | 0.054 | 0.055 |
| PSQ | |||
| Snoring* | 7.224 (1, 66) | 0.009 | 0.099 |
| Sleepiness* | 5.233 (1, 66) | 0.025 | 0.073 |
| Behavior* | 25.52 (1, 66) | <.001 | 0.279 |
Note:
p < .05 level,
p < .10 level,
df = degrees of freedom, CSHQ = Children’s Sleep Habits Questionnaire, PSQ = Pediatric Sleep Questionnaire.
To probe the statistically significant multivariate effects of group, univariate ANOVAs were conducted on each dependent variable. There was a statistically significant main effect of group on CSHQ Night Wakings and Parasomnias, and PSQ Snoring, Sleepiness, and Behavior, such that AE had higher parent-reported scores than CON. There was also a trend-level main effect of group on CSHQ Sleep Onset Delay and Daytime Sleepiness; AE had higher parent-reported scores than CON on these subscales. Within the AE group, 17 screened positive on the PSQ (score ≥8); within the CON group, 5 screened positive. On the CSHQ, 28 screened positive in the AE group (score ≥41), and 25 screened positive in the CON group.
When split by age (mid-point of 8.5 years old), a univariate ANOVA revealed there were no significant group differences in CSHQ Total Score among the children less than 8.5 years of age; however, in children greater than 8.5 years old, AE had significantly higher CSHQ Total Score than CON (F[1,34]=12.716, p<.001; see Figure 4B).
Figure 4.
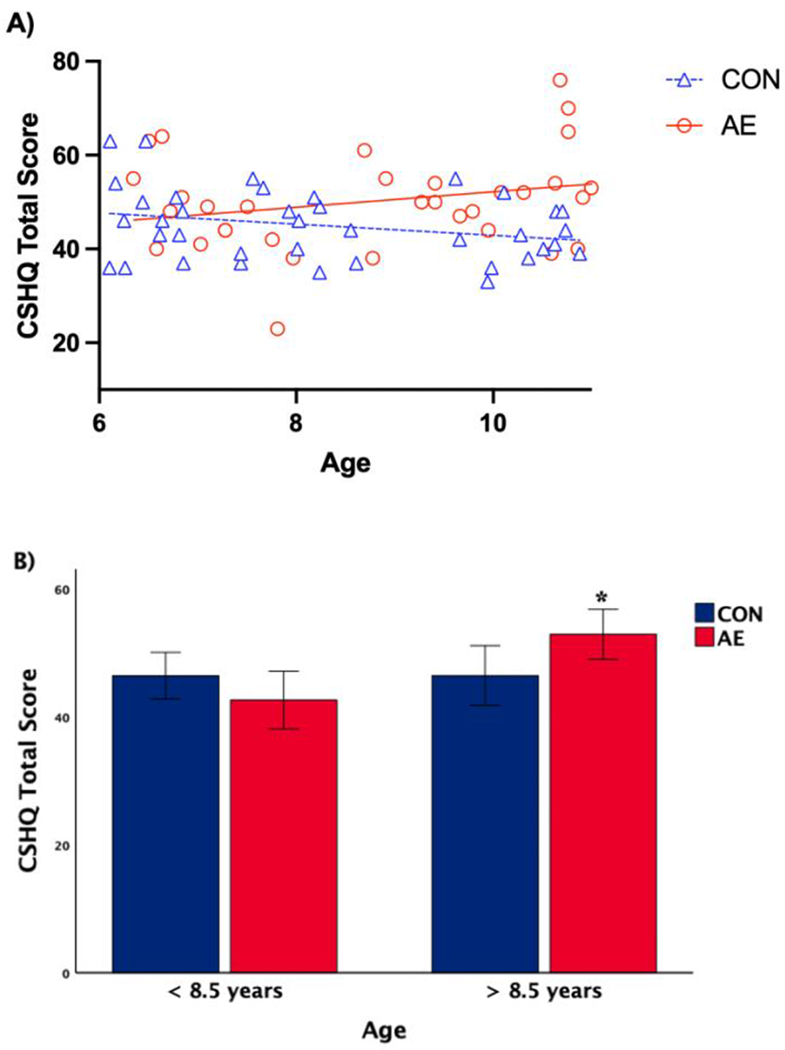
Multiple regression modeling [A] and univariate analysis of variance [B] results for group by age interaction effect on CSHQ Total Score. CSHQ Total Score in children with AE increased with age, whereas there was no significant relationship in controls (p < .05). There were no significant group differences in CSHQ Total Score among children <8.5 years old, but in children >8.5 years old, AE scored significantly higher compared to CON (p < .05, with SEM error bar).
DISCUSSION
A limited number of studies have demonstrated that children with PAE have sleep problems, including fragmented sleep, increased arousal during sleep, and melatonin secretion abnormalities. This study aimed to characterize the sleep profile in children with PAE to lay the foundation for developing interventions to target sleep in this population. Actigraphy measures showed that children with PAE had greater intraindividual sleep variability than controls, despite similar sleep metrics when averaged across two weeks. On questionnaires, parents reported more problems related to sleep behavior (e.g., night wakings, parasomnias), snoring, and daytime sleepiness in children with PAE group than in controls.
Actigraphy
Overall, there were no group differences on average actigraphy sleep metrics. Both groups slept approximately 8 hours on average, with nearly identical percent sleep (87.1% vs. 87.2%), which is similar to values observed in a large polysomnography study of FASD (Dylag et al., 2021). Despite similar two-week averages on actigraphy variables, the AE group had significantly greater levels of intraindividual (night-to-night) variability in WASO, number of wake bouts, sleep time, and percent sleep, relative to controls. There were no COVID-related differences in sleep metrics across the sample or in either group.
Although the use of actigraphy to study sleep in children with FASD has been very limited, these findings are similar to those observed by Wengel and colleagues (Wengel et al., 2011), who found no significant differences between children with FASD and controls ages 3 to 6 on one-week average actigraphy measures of sleep efficiency, sleep percent, sleep time, or number of wake bouts. In contrast, another week-long actigraphy study of children ages 6 to 12 showed that the FASD group had lower average sleep time and sleep efficiency, and more fragmentation than typically developing controls (Mughal et al., 2020). Examining the means reported in the study by Mughal et al. (2020) in children 6 to 12 years old, the alcohol-exposed group had 6 hours 58 minutes of actual sleep time on average, whereas our AE group had 8 hours 21 minutes. There were also significant differences between their alcohol-exposed and control groups on sleep efficiency and sleep fragmentation measures, such that the alcohol-exposed group had lower mean sleep efficiency and higher mean fragmentation index scores. In contrast, our AE and CON groups were very similar on these metrics. Although intraindividual variability metrics were not reported, the standard deviation of actual sleep time in the Mughal et al. (2020) study was more than 1 hour (FASD: 1 hour 11 minutes, Control: 1 hour 4 minutes), suggesting high variability in this measure across both groups.
Importantly, actigraphy is not the gold-standard of sleep measurement and has a low specificity (i.e., accuracy) in detecting wakefulness during periods of sleep (Sadeh, 2011). Compared to polysomnography, the gold-standard for sleep evaluation, actigraphy has high sensitivity (ability to detect sleep), but low specificity (ability to detect wakefulness) (Martin and Hakim, 2011, de Souza et al., 2003, Van de Water et al., 2011). Interestingly, sleep diary metrics were significantly higher than actigraphy metrics for both groups, which may reflect an overestimation of sleep duration by caregivers when filling out the sleep diary, an underestimation of sleep duration as measured by actigraphy, or a combination of the two. The lack of observed group differences on average actigraphy metrics may also reflect unmeasured characteristics of the AE group (e.g., level of family/home environment stability, parenting style, stress level) that fostered overall sleep variables that were relatively similar to the CON group. Although the CON group showed average sleep time similar to that observed in the Mughal et al. (2020) control sample, it should be noted that our CON sample included children who had behavioral concerns and diagnoses (e.g., ADHD, anxiety, depression) that are also related to sleep disturbance. In addition, there may have been selection bias such that control families may have been more likely to participate in the study if they had concerns about sleep and/or pre-existing sleep problems.
Despite similarities in average sleep metrics, AE subjects showed significantly greater intraindividual variability in number of awakenings, time spent awake (WASO), sleep time, and percent sleep. Few studies have examined the implications of nightly variations in sleep, although research has increasingly demonstrated that intraindividual variability in sleep patterns is related to a variety of physical and mental health outcomes (Becker et al., 2017). For example, frequent changes in sleep timing can disrupt the sleep-wake cycle, which can then affect sleep structure, sleep consolidation, and sleep-related biological functions (e.g., hormone expression) (Bangerter et al., 2020, Phillips et al., 2017, Konen et al., 2015). Indeed, data from polysomnography indicate that children with FASD show altered sleep structure, with a higher number of stage shifts and arousals than controls (Dylag et al., 2021). In addition, melatonin secretion abnormalities (Goril et al., 2016) have also been described, implicating disturbed regulation of sleep-wake cycles. Sleep research has traditionally focused on mean sleep variables (e.g., average sleep duration); however, mean sleep/wake variables and intraindividual variability in sleep may have distinct etiologies (Becker et al., 2017; Bei et al., 2016). The biological bases of overall sleep/wake patterns, which are driven by homeostatic drive and circadian rhythm, tend to be relatively stable across days; in contrast, many other factors, such as physical health, stress, home environment, and sleep deprivation/disruption have the potential to affect sleep/wake cycles on a day-to-day basis (Bei et al., 2016). Children with FASD are often exposed to adverse environmental circumstances and stressors in the home environment (Streissguth et al., 2004). Although these variables were not measured as part of this study, these psychosocial factors may contribute to the elevated sleep variability metrics in our sample. One study has shown that exposure to adversity is related to higher levels of caregiver-reported sleep problems in FASD (Chandler-Mather et al., 2023). Additionally, preclinical evidence suggests that developmental alcohol exposure affects the expression of clock genes, which play an important role in generating biological rhythms, including the circadian rhythm (Chen et al., 2006). Sarkar et al. (2019) found that children with FASD had increased methylation of two genes that are critical to stress and circadian regulation: period 2 (PER2) and proopiomelanocortin (POMC). Although further study in humans is needed, these alterations in gene expression may disrupt circadian rhythmicity, and as a result, destabilize the sleep/wake cycle. Differential expression of stress and clock genes could therefore point to specific biological mechanisms that underlie the elevated sleep time variability observed in the AE group.
Another factor to consider is the influence of ADHD diagnosis on sleep quality, as meta-analytic results show that children with ADHD have more sleep difficulties based on objective (i.e., polysomnography, actigraphy, multiple sleep latency test) and subjective (i.e., questionnaire) measures of sleep (Cortese et al., 2009). Nearly half of the AE group (15 children, 43%) had a parent-reported diagnosis of ADHD. Within the AE group, children without ADHD (AE/ADHD−) had higher average sleep time and lower variability of WASO, number of wake bouts, percent sleep, and sleep fragmentation compared to children with ADHD (AE/ADHD+). Participants in the AE group had similar rates of stimulant use, regardless of ADHD diagnosis (AE/ADHD+: n=8; AE/ADHD−: n=5; two children were taking stimulants but had missing data for ADHD diagnosis). In an analysis that excluded participants with ADHD from both groups, the AE/ADHD− group showed greater average sleep time, but significantly higher intraindividual variability in sleep time, compared to the CON/ADHD− group. Interestingly, there was no difference in intraindividual sleep time variability when stratifying by ADHD diagnosis in the AE group. These findings suggest that children with PAE, but without a diagnosis of ADHD, still exhibit sleep time variability that is comparable to that of alcohol-exposed children with ADHD, and significantly greater than the sleep time variability observed in controls. It is therefore possible that PAE may uniquely contribute to night-to-night variability in total sleep time.
Sleep Questionnaires
On parent-report questionnaires measuring children’s sleep problems, the AE group had significantly higher scores than the CON group. Notably, the AE and CON groups each had average CSHQ total scores above the clinically significant cutoff score of 41, reflecting a high level of reported sleep problems in both groups. Even still, the AE group had significantly higher total scores on the CSHQ, specifically driven by elevated problems with night awakenings and parasomnias (e.g., sleep walking) and greater sleep onset delay, and trend-level differences for problems related to daytime sleepiness. Although we hypothesized there would be group differences on more CSHQ subscales, this profile is similar to findings from Dylag et al. (2021), who found higher scores for FASD on the sleep onset delay, night wakings, parasomnias, and daytime sleepiness subscales, as well as the sleep disordered breathing subscale. In addition, the elevated CSHQ total score is consistent with results from prior studies showing that children with FASD had CSHQ total scores above the clinical cutoff (Chen et al., 2012; Wengel et al., 2011).
The AE group also had significantly higher PSQ total scores, driven by all three subscales for snoring, sleepiness, and behavior. A significantly larger proportion of the AE group screened positive for a sleep-related breathing disorder (17 children) compared to the CON group (5 children); therefore, it is possible that sleep-related breathing disorders may contribute to the observed group differences in sleep variability measured by actigraphy. It is also important to note that the PSQ Behavior subscale contains items that assess inattentive/hyperactive behavior, which are hallmark symptoms of FASD. Although there were five children in the CON group with parent-reported diagnoses of ADHD, a significantly larger proportion of the AE group had ADHD (15 children), which may have contributed to the high PSQ Total Score in the AE group. However, the group difference on the Sleepiness subscale, coupled with higher daytime sleepiness scores on the CSHQ, suggests that regardless of behavior, the AE group had more problems with sleepiness during the day. Further analyses revealed that within the AE group, when stratifying by ADHD diagnosis, there were no group differences on PSQ Total Score. However, closer examination of subscales showed that AE/ADHD+ exhibited higher PSQ Behavior scores than AE/ADHD−. In addition, the AE/ADHD+ group showed significantly higher scores than the AE/ADHD− group on CSHQ subscales for bedtime resistance, sleep anxiety, and night wakings, despite similar CSHQ total scores. Taken together, these results suggest that ADHD diagnosis and stimulant medication use may be additional specific driving factors of sleep difficulties that should be further explored in FASD.
Parent/caregiver-reported sleep problems in children with FASD have been associated with poorer caregiver quality of life, decreased daily family activities, and higher levels of anxiety and worry (Hayes et al., 2020). Although measuring caregiver functioning was outside the scope of the current study, sleep problems affect not only the functioning of the child, but also the functioning and well-being of caregivers and the family unit (Hayes et al., 2020; Ipsiroglu et al., 2013). In one qualitative study, it was noted that child sleep problems contributed to caregiver exhaustion and the need for respite care, sometimes even leading to breakdown in the child’s foster and home placement (Ipsiroglu et al., 2013). When caregivers feel supported to manage the behavior and complex needs of their child with FASD, they are better able to provide a positive, stable home environment, which is a major factor in improving outcomes for individuals affected by PAE (Petrenko et al., 2014, Streissguth et al., 2004, Hayes et al., 2020). Our findings of clinically significant parent-reported sleep problems further emphasize the need to identify sleep difficulties, not only for the direct benefit of the affected child, but also the well-being of the caregiver and family. In turn, enhancing the functioning of the family as a whole will promote optimal outcomes for the child’s quality of life.
Age
Results indicate that night-to-night variability in sleep quality and parent-reported sleep problems increased with age in children with PAE, but not in controls. Studies of typically developing children have found that parent-reported sleep problems on questionnaires (e.g., CSHQ) decrease with age (Gregory and O’Connor, 2002, Sivertsen et al., 2012, Richdale and Prior, 1995, Owens et al., 2000b). While meta-analyses of pediatric actigraphy studies show total sleep time decreases across age in children (Galland et al., 2018), few studies have examined the effect of age on sleep variability, and these findings are mixed (Becker et al., 2017). One study found no effect of age (Becker et al., 2017), while another found that older age was associated with greater variability in sleep onset and waking (Buckhalt et al., 2007). Given these mixed results, it is possible that certain sleep variability measures stay constant across school ages. In children with PAE, greater sleep variability with increasing age may suggest that the developmental trajectory of neural systems involved in sleep is altered following PAE or that children with PAE are more sensitive to environmental factors that influence sleep. Further, significant age-related interactions indicate that combining children with wide age-ranges into one category may obfuscate critical findings about developmental differences in sleep. Longitudinal studies are needed to better understand age-related sleep changes. In addition, there may be a large window of opportunity to deliver sleep interventions, as effects of PAE on sleep quality become more pronounced with age. Identification of a developmental target window for intervention is an important future research direction.
Implications for Intervention
Although the present study did not show group differences with respect to average sleep outcomes on objective measures, both AE and CON had clinically relevant sleep problems, as reported on parent sleep questionnaires. It is critical to identify and treat sleep problems, regardless of prenatal exposure to alcohol. Our most robust finding was that sleep patterns in children with PAE are characterized by intraindividual variability across multiple sleep actigraphy outcomes. Most sleep research has focused on average sleep metrics, consequently, recommendations for intervention and public policy changes have targeted overall nightly sleep duration as the metric for optimal sleep health. However, our findings add to a growing body of literature demonstrating disruptions in night-to-night sleep consistency in clinical populations, independent of mean-based sleep metrics (Becker et al., 2017). The few intervention studies examining sleep intraindividual variability have shown mixed results and are limited by small sample sizes and lack of randomized design and active control groups (Becker et al., 2017), but brief sleep hygiene interventions (i.e., setting a consistent bed/wake-time, discontinuing naps and caffeine use) show some promise in stabilizing sleep. In a systematic review of intraindividual variability of sleep patterns in children, less optimal sleep environment, such as watching TV or falling asleep with the lights on, and less structured environmental schedules, such as during weekends and vacations, were related to greater sleep intraindividual variability (Becker et al., 2017). Adaptive bedtime routine activities, such as putting on pajamas, brushing teeth, bedtime hugs, and being tucked in were associated with lower variability in sleep duration and sleep quality (Spruyt et al., 2012). Importantly, sleep is a modifiable behavior, and problems with sleep variability present a significant area for intervention, with the potential to impact quality of life in children with FASD and their families (Hayes et al., 2020). Specific interventions for sleep in the FASD population have not been adequately examined and represent an important goal.
Limitations and Future Directions
The current study is limited by several factors. First, a portion of the study data was collected during a global pandemic, during which stay-at-home orders were implemented and children were typically attending school online. Although there were no significant group differences between subjects who participated prior to the pandemic and during the pandemic, it is possible that this unique situation affected sleep and behavior in both positive and negative ways that were not directly measured by our study. Scheduling differences between school, vacation, and pandemic periods, as well as stress, could also be another source of variability in our sample (Suratt et al., 2007).
Heterogeneity within both the alcohol-exposed and control groups may have limited our ability to detect group differences in average sleep parameters. Within the AE group, the quantity and timing of alcohol exposure in utero may have had a heterogeneous impact on intrauterine development of sleep-wake regulation, leading to diverse sleep outcomes in childhood. Heterogeneity of the control group also represents a strength of the study: by including controls with sleep issues, ADHD, and other behavioral problems, but without PAE, our findings suggest that the observed group differences may be unique to FASD. Future studies should consider including a separate behavioral contrast group (e.g., children with ADHD or other behavioral concerns) to better understand the specificity of these relationships.
The AE group had significantly higher scores than controls on the PSQ, including the Snoring subscale, suggesting that sleep disruptions in the AE group may be partially due to sleep-related breathing problems. However, actigraphy alone cannot detect sleep-related breathing problems, such as obstructive sleep apnea. Group differences were also observed in the use of melatonin, which can contribute to changes in sleep timing, and other medications that can affect sleep quality (e.g., stimulants, antidepressants, antipsychotics). Future studies should consider how medication use affects sleep in this population.
Given the group differences in sleep time intraindividual variability, future studies should also examine potential contributions of altered circadian rhythmicity. Preclinical and clinical data indicate that PAE is associated with differential expression of clock genes, which are instrumental in generating biological rhythms at the cellular level (Chen et al., 2006, Farnell et al., 2008, Sarkar et al., 2019). Disruptions in circadian rhythm and clock gene expression could be a biological mechanism that contributes to sleep variability, but further study of these relationships is needed.
Conclusions
The current study demonstrated that while children with PAE and controls had similar average sleep characteristics, there was substantial intraindividual variability in sleep quality among the alcohol-exposed children. Parents of children with PAE reported clinically significant levels of sleep problems, including night wakings, parasomnias, snoring, and daytime sleepiness.
Given the high rate of subjective and objectively measured sleep problems in alcohol-exposed individuals, sleep intervention trials are a critical area of research in FASD. Sleep hygiene strategies such as setting a consistent bedtime and wake time (including weekends), implementing bedtime routines, and optimizing the environment for sleep (e.g., turning off the TV, limiting screen time before bed) hold promise for stabilizing sleep, and have been efficacious in reducing sleep problems in children with ADHD and autism spectrum disorders (Weiskop et al., 2005, Corkum et al., 2016).
Overall, sleep disturbance is a significant, clinically relevant issue in individuals with FASD. Identifying and treating sleep disorders is essential to the health and well-being of alcohol-exposed children. Furthermore, understanding the characteristics of sleep problems will help to target interventions and maximize the quality of life of affected children and their families.
Supplementary Material
Acknowledgements
We thank the families who graciously participated in this study. We also thank Samirah Hussain, Taraneh Jahan, Kelly Kao, and Marla Castaneda for their assistance in recruitment and data collection. The authors have no financial or other conflicts of interest. Research described in this paper was supported by NIAAA grants R21AA026697, F31AA027148, and T32AA013525.
Contributor Information
Sarah M. Inkelis, Department of Neurology, University of California San Francisco, San Francisco, California, USA
Jacqueline Soja, Center for Behavioral Teratology, Department of Psychology, San Diego State University, San Diego, California, USA
Sarah N. Mattson, Center for Behavioral Teratology, Department of Psychology, San Diego State University, San Diego, California, USA
Christina D. Chambers, Department of Pediatrics, University of California San Diego, San Diego, California, USA
Rakesh Bhattacharjee, Department of Pediatrics, University of California San Diego, San Diego, California, USA
Jennifer D. Thomas, Center for Behavioral Teratology, Department of Psychology, San Diego State University, San Diego, California, USA
REFERENCES
- American Academy of Pediatrics (2000) Committee on Substance Abuse and Committee on Children With Disabilities. Fetal alcohol syndrome and alcohol-related neurodevelopmental disorders. Pediatrics 106:358–361. [PubMed] [Google Scholar]
- Bangerter A, Chatterjee M, Manyakov NV, Ness S, Lewin D, Skalkin A, Boice M, Goodwin MS, Dawson G, Hendren R, Leventhal B, Shic F, Esbensen A, Pandina G (2020) Relationship Between Sleep and Behavior in Autism Spectrum Disorder: Exploring the Impact of Sleep Variability. Front Neurosci 14:211. [DOI] [PMC free article] [PubMed] [Google Scholar]
- Becker SP, Sidol CA, Van Dyk TR, Epstein JN, Beebe DW (2017) Intraindividual variability of sleep/wake patterns in relation to child and adolescent functioning: A systematic review. Sleep Med Rev 34:94–121. [DOI] [PMC free article] [PubMed] [Google Scholar]
- Bei B, Wiley JF, Trinder J, Manber R (2016) Beyond the mean: A systematic review on the correlates of daily intraindividual variability of sleep/wake patterns. Sleep Med Rev 28:108–124. [DOI] [PubMed] [Google Scholar]
- Buckhalt JA, El-Sheikh M, Keller P (2007) Children’s sleep and cognitive functioning: race and socioeconomic status as moderators of effects. Child Dev 78:213–231. [DOI] [PubMed] [Google Scholar]
- Chandler-Mather N, Occhipinti S, Donovan C, Shelton D, Dawe S (2021) An investigation of the link between prenatal alcohol exposure and sleep problems across childhood. Drug Alcohol Depend 218:108412. [DOI] [PubMed] [Google Scholar]
- Chen CP, Kuhn P, Advis JP, Sarkar DK (2006) Prenatal ethanol exposure alters the expression of period genes governing the circadian function of beta-endorphin neurons in the hypothalamus. J Neurochem 97:1026–1033. [DOI] [PubMed] [Google Scholar]
- Chen ML, Olson HC, Picciano JF, Starr JR, Owens J (2012) Sleep problems in children with fetal alcohol spectrum disorders. J Clin Sleep Med 8:421–429. [DOI] [PMC free article] [PubMed] [Google Scholar]
- Chervin RD, Hedger K, Dillon JE, Pituch KJ (2000) Pediatric sleep questionnaire (PSQ): validity and reliability of scales for sleep-disordered breathing, snoring, sleepiness, and behavioral problems. Sleep Med 1:21–32. [DOI] [PubMed] [Google Scholar]
- Corkum P, Lingley-Pottie P, Davidson F, McGrath P, Chambers CT, Mullane J, Laredo S, Woodford K, Weiss SK (2016) Better Nights/Better Days-Distance Intervention for Insomnia in School-Aged Children With/Without ADHD: A Randomized Controlled Trial. J Pediatr Psychol 41:701–713. [DOI] [PubMed] [Google Scholar]
- Dahl RE (1996) The impact of inadequate sleep on children’s daytime cognitive function. Semin Pediatr Neurol 3:44–50. [DOI] [PubMed] [Google Scholar]
- de Souza L, Benedito-Silva AA, Pires ML, Poyares D, Tufik S, Calil HM (2003) Further validation of actigraphy for sleep studies. Sleep 26:81–85. [DOI] [PubMed] [Google Scholar]
- Donald KA, Eastman E, Howells FM, Adnams C, Riley EP, Woods RP, Narr KL, Stein DJ (2015) Neuroimaging effects of prenatal alcohol exposure on the developing human brain: a magnetic resonance imaging review. Acta Neuropsychiatr 27:251–269. [DOI] [PubMed] [Google Scholar]
- Dylag KA, Bando B, Baran Z, Dumnicka P, Kowalska K, Kulaga P, Przybyszewska K, Radlinski J, Roozen S, Curfs L (2021) Sleep problems among children with Fetal Alcohol Spectrum Disorders (FASD)- an explorative study. Ital J Pediatr 47:113. [DOI] [PMC free article] [PubMed] [Google Scholar]
- Earnest DJ, Chen WJ, West JR (2001) Developmental alcohol and circadian clock function. Alcohol Res Health 25:136–140. [PMC free article] [PubMed] [Google Scholar]
- Farnell YZ, Allen GC, Nahm SS, Neuendorff N, West JR, Chen WJ, Earnest DJ (2008) Neonatal alcohol exposure differentially alters clock gene oscillations within the suprachiasmatic nucleus, cerebellum, and liver of adult rats. Alcohol Clin Exp Res 32:544–552. [DOI] [PMC free article] [PubMed] [Google Scholar]
- Faul F, Erdfelder E, Lang AG, Buchner A (2007) G*Power 3: a flexible statistical power analysis program for the social, behavioral, and biomedical sciences. Behav Res Methods 39:175–191. [DOI] [PubMed] [Google Scholar]
- Galland BC, Short MA, Terrill P, Rigney G, Haszard JJ, Coussens S, Foster-Owens M, Biggs SN (2018) Establishing normal values for pediatric nighttime sleep measured by actigraphy: a systematic review and meta-analysis. Sleep 41. [DOI] [PubMed] [Google Scholar]
- Gerstner T, Saevareid HI, Johnsen AR, Lohaugen G, Skranes J (2023) Sleep disturbances in Norwegian children with fetal alcohol spectrum disorders (FASD) with and without a diagnosis of attention-deficit hyperactivity disorder or epilepsy. Alcohol Clin Exp Res (Hoboken) 47:589–599. [DOI] [PubMed] [Google Scholar]
- Goril S, Zalai D, Scott L, Shapiro CM (2016) Sleep and melatonin secretion abnormalities in children and adolescents with fetal alcohol spectrum disorders. Sleep Medicine 23:59–64. [DOI] [PubMed] [Google Scholar]
- Gozal D, O’Brien L, Row BW (2004) Consequences of snoring and sleep disordered breathing in children. Pediatr Pulmonol Suppl 26:166–168. [DOI] [PubMed] [Google Scholar]
- Gregory AM, O’Connor TG (2002) Sleep problems in childhood: a longitudinal study of developmental change and association with behavioral problems. J Am Acad Child Adolesc Psychiatry 41:964–971. [DOI] [PubMed] [Google Scholar]
- Hayes N, Moritz KM, Reid N (2020) Parent-reported sleep problems in school-aged children with fetal alcohol spectrum disorder: association with child behaviour, caregiver, and family functioning. Sleep Med 74:307–314. [DOI] [PubMed] [Google Scholar]
- Hilakivi L (1986) Effects of prenatal alcohol exposure on neonatal sleep-wake behaviour and adult alcohol consumption in rats. Acta Pharmacol Toxicol (Copenh) 59:36–42. [DOI] [PubMed] [Google Scholar]
- Ingrassia A, Turk J (2005) The use of clonidine for severe and intractable sleep problems in children with neurodevelopmental disorders--a case series. Eur Child Adolesc Psychiatry 14:34–40. [DOI] [PubMed] [Google Scholar]
- Inkelis SM, Thomas JD (2018) Sleep in Infants and Children with Prenatal Alcohol Exposure. Alcohol Clin Exp Res. [DOI] [PMC free article] [PubMed] [Google Scholar]
- Ipsiroglu OS, McKellin WH, Carey N, Loock C (2013) “They silently live in terror…” why sleep problems and night-time related quality-of-life are missed in children with a fetal alcohol spectrum disorder. Soc Sci Med 79:76–83. [DOI] [PubMed] [Google Scholar]
- Ipsiroglu OS, Wind K, Hung YA, Berger M, Chan F, Yu W, Stockler S, Weinberg J (2019) Prenatal alcohol exposure and sleep-wake behaviors: exploratory and naturalistic observations in the clinical setting and in an animal model. Sleep Med 54:101–112. [DOI] [PMC free article] [PubMed] [Google Scholar]
- Jan JE, Asante KO, Conry JL, Fast DK, Bax MC, Ipsiroglu OS, Bredberg E, Loock CA, Wasdell MB (2010) Sleep Health Issues for Children with FASD: Clinical Considerations. Int J Pediatr 2010. [DOI] [PMC free article] [PubMed] [Google Scholar]
- Jones KL, Robinson LK, Bakhireva LN, Marintcheva G, Storojev V, Strahova A, Sergeevskaya S, Budantseva S, Mattson SN, Riley EP, Chambers CD (2006) Accuracy of the diagnosis of physical features of fetal alcohol syndrome by pediatricians after specialized training. Pediatrics 118:e1734–1738. [DOI] [PubMed] [Google Scholar]
- Jones KL, Smith DW (1975) The fetal alcohol syndrome. Teratology 12:1–10. [DOI] [PubMed] [Google Scholar]
- Kautz-Turnbull C, Adams TR, Petrenko CLM (2022) The Strengths and Positive Influences of Children With Fetal Alcohol Spectrum Disorders. Am J Intellect Dev Disabil 127:355–368. [DOI] [PMC free article] [PubMed] [Google Scholar]
- Kheirandish L, Gozal D (2006) Neurocognitive dysfunction in children with sleep disorders. Developmental science 9:388–399. [DOI] [PubMed] [Google Scholar]
- Konen T, Dirk J, Schmiedek F (2015) Cognitive benefits of last night’s sleep: daily variations in children’s sleep behavior are related to working memory fluctuations. J Child Psychol Psychiatry 56:171–182. [DOI] [PubMed] [Google Scholar]
- Martin JL, Hakim AD (2011) Wrist actigraphy. Chest 139:1514–1527. [DOI] [PMC free article] [PubMed] [Google Scholar]
- Mattson SN, Bernes GA, Doyle LR (2019) Fetal Alcohol Spectrum Disorders: A Review of the Neurobehavioral Deficits Associated With Prenatal Alcohol Exposure. Alcohol Clin Exp Res 43:1046–1062. [DOI] [PMC free article] [PubMed] [Google Scholar]
- Mattson SN, Crocker N, Nguyen TT (2011) Fetal alcohol spectrum disorders: neuropsychological and behavioral features. Neuropsychol Rev 21:81–101. [DOI] [PMC free article] [PubMed] [Google Scholar]
- May PA, Chambers CD, Kalberg WO, Zellner J, Feldman H, Buckley D, Kopald D, Hasken JM, Xu R, Honerkamp-Smith G, Taras H, Manning MA, Robinson LK, Adam MP, Abdul-Rahman O, Vaux K, Jewett T, Elliott AJ, Kable JA, Akshoomoff N, Falk D, Arroyo JA, Hereld D, Riley EP, Charness ME, Coles CD, Warren KR, Jones KL, Hoyme HE (2018) Prevalence of Fetal Alcohol Spectrum Disorders in 4 US Communities. JAMA 319:474–482. [DOI] [PMC free article] [PubMed] [Google Scholar]
- Meltzer LJ, Montgomery-Downs HE, Insana SP, Walsh CM (2012) Use of actigraphy for assessment in pediatric sleep research. Sleep Med Rev 16:463–475. [DOI] [PMC free article] [PubMed] [Google Scholar]
- Meltzer LJ, Plaufcan MR, Thomas JH, Mindell JA (2014) Sleep problems and sleep disorders in pediatric primary care: treatment recommendations, persistence, and health care utilization. J Clin Sleep Med 10:421–426. [DOI] [PMC free article] [PubMed] [Google Scholar]
- Morgenthaler T, Alessi C, Friedman L, Owens J, Kapur V, Boehlecke B, Brown T, Chesson A Jr., Coleman J, Lee-Chiong T, Pancer J, Swick TJ, Standards of Practice C, American Academy of Sleep M (2007) Practice parameters for the use of actigraphy in the assessment of sleep and sleep disorders: an update for 2007. Sleep 30:519–529. [DOI] [PubMed] [Google Scholar]
- Mughal R, Hill CM, Joyce A, Dimitriou D (2020) Sleep and Cognition in Children with Fetal Alcohol Spectrum Disorders (FASD) and Children with Autism Spectrum Disorders (ASD). Brain Sci 10. [DOI] [PMC free article] [PubMed] [Google Scholar]
- Mughal R, Wong SS, Dimitriou D, Halstead E (2021) Nightmares in Children with Foetal Alcohol Spectrum Disorders, Autism Spectrum Disorders, and Their Typically Developing Peers. Clocks Sleep 3:465–481. [DOI] [PMC free article] [PubMed] [Google Scholar]
- Mulder EJ, Morssink LP, van der Schee T, Visser GH (1998) Acute maternal alcohol consumption disrupts behavioral state organization in the near-term fetus. Pediatr Res 44:774–779. [DOI] [PubMed] [Google Scholar]
- Mullington JM, Haack M, Toth M, Serrador JM, Meier-Ewert HK (2009) Cardiovascular, inflammatory, and metabolic consequences of sleep deprivation. Prog Cardiovasc Dis 51:294–302. [DOI] [PMC free article] [PubMed] [Google Scholar]
- Owens JA, Spirito A, McGuinn M (2000a) The Children’s Sleep Habits Questionnaire (CSHQ): psychometric properties of a survey instrument for school-aged children. Sleep 23:1043–1051. [PubMed] [Google Scholar]
- Owens JA, Spirito A, McGuinn M, Nobile C (2000b) Sleep habits and sleep disturbance in elementary school-aged children. J Dev Behav Pediatr 21:27–36. [DOI] [PubMed] [Google Scholar]
- Pesonen AK, Raikkonen K, Matthews K, Heinonen K, Paavonen JE, Lahti J, Komsi N, Lemola S, Jarvenpaa AL, Kajantie E, Strandberg T (2009) Prenatal origins of poor sleep in children. Sleep 32:1086–1092. [DOI] [PMC free article] [PubMed] [Google Scholar]
- Petrenko CL, Tahir N, Mahoney EC, Chin NP (2014) Prevention of secondary conditions in fetal alcohol spectrum disorders: identification of systems-level barriers. Matern Child Health J 18:1496–1505. [DOI] [PMC free article] [PubMed] [Google Scholar]
- Phillips AJK, Clerx WM, O’Brien CS, Sano A, Barger LK, Picard RW, Lockley SW, Klerman EB, Czeisler CA (2017) Irregular sleep/wake patterns are associated with poorer academic performance and delayed circadian and sleep/wake timing. Sci Rep 7:3216. [DOI] [PMC free article] [PubMed] [Google Scholar]
- Richdale AL, Prior MR (1995) The sleep/wake rhythm in children with autism. Eur Child Adolesc Psychiatry 4:175–186. [DOI] [PubMed] [Google Scholar]
- Robinson-Shelton A, Malow BA (2016) Sleep Disturbances in Neurodevelopmental Disorders. Curr Psychiatry Rep 18:6. [DOI] [PubMed] [Google Scholar]
- Roozen S, Peters GJ, Kok G, Townend D, Nijhuis J, Curfs L (2016) Worldwide Prevalence of Fetal Alcohol Spectrum Disorders: A Systematic Literature Review Including Meta-Analysis. Alcohol Clin Exp Res 40:18–32. [DOI] [PubMed] [Google Scholar]
- Rzepecka H, McKenzie K, McClure I, Murphy S (2011) Sleep, anxiety and challenging behaviour in children with intellectual disability and/or autism spectrum disorder. Research in developmental disabilities 32:2758–2766. [DOI] [PubMed] [Google Scholar]
- Sadeh A (2011) The role and validity of actigraphy in sleep medicine: an update. Sleep Med Rev 15:259–267. [DOI] [PubMed] [Google Scholar]
- Sakata-Haga H, Dominguez HD, Sei H, Fukui Y, Riley EP, Thomas JD (2006) Alterations in circadian rhythm phase shifting ability in rats following ethanol exposure during the third trimester brain growth spurt. Alcohol Clin Exp Res 30:899–907. [DOI] [PubMed] [Google Scholar]
- Sarkar DK, Gangisetty O, Wozniak JR, Eckerle JK, Georgieff MK, Foroud TM, Wetherill L, Wertelecki W, Chambers CD, Riley E, Zymak-Zakutnya N, Yevtushok L (2019) Persistent Changes in Stress-Regulatory Genes in Pregnant Women or Children Exposed Prenatally to Alcohol. Alcohol Clin Exp Res 43:1887–1897. [DOI] [PMC free article] [PubMed] [Google Scholar]
- Scher MS, Richardson GA, Day NL (2000) Effects of prenatal cocaine/crack and other drug exposure on electroencephalographic sleep studies at birth and one year. Pediatrics 105:39–48. [DOI] [PubMed] [Google Scholar]
- Sivertsen B, Posserud MB, Gillberg C, Lundervold AJ, Hysing M (2012) Sleep problems in children with autism spectrum problems: a longitudinal population-based study. Autism 16:139–150. [DOI] [PubMed] [Google Scholar]
- Spruyt K, Raubuck DL, Grogan K, Gozal D, Stein MA (2012) Variable sleep schedules and outcomes in children with psychopathological problems: preliminary observations. Nat Sci Sleep 4:9–17. [DOI] [PMC free article] [PubMed] [Google Scholar]
- Streissguth AP, Bookstein FL, Barr HM, Sampson PD, O’Malley K, Young JK (2004) Risk factors for adverse life outcomes in fetal alcohol syndrome and fetal alcohol effects. J Dev Behav Pediatr 25:228–238. [DOI] [PubMed] [Google Scholar]
- Suratt PM, Barth JT, Diamond R, D’Andrea L, Nikova M, Perriello VA Jr., Carskadon MA, Rembold C (2007) Reduced time in bed and obstructive sleep-disordered breathing in children are associated with cognitive impairment. Pediatrics 119:320–329. [DOI] [PubMed] [Google Scholar]
- Troese M, Fukumizu M, Sallinen BJ, Gilles AA, Wellman JD, Paul JA, Brown ER, Hayes MJ (2008) Sleep fragmentation and evidence for sleep debt in alcohol-exposed infants. Early Hum Dev 84:577–585. [DOI] [PubMed] [Google Scholar]
- Van de Water AT, Holmes A, Hurley DA (2011) Objective measurements of sleep for non-laboratory settings as alternatives to polysomnography--a systematic review. J Sleep Res 20:183–200. [DOI] [PubMed] [Google Scholar]
- Weiskop S, Richdale A, Matthews J (2005) Behavioural treatment to reduce sleep problems in children with autism or fragile X syndrome. Dev Med Child Neurol 47:94–104. [DOI] [PubMed] [Google Scholar]
- Wengel T, Hanlon-Dearman AC, Fjeldsted B (2011) Sleep and sensory characteristics in young children with fetal alcohol spectrum disorder. J Dev Behav Pediatr 32:384–392. [DOI] [PubMed] [Google Scholar]
- Zgodic A, McLain AC, Eberth JM, Federico A, Bradshaw J, Flory K (2023) County-level prevalence estimates of ADHD in children in the United States. Ann Epidemiol 79:56–64. [DOI] [PMC free article] [PubMed] [Google Scholar]
Associated Data
This section collects any data citations, data availability statements, or supplementary materials included in this article.