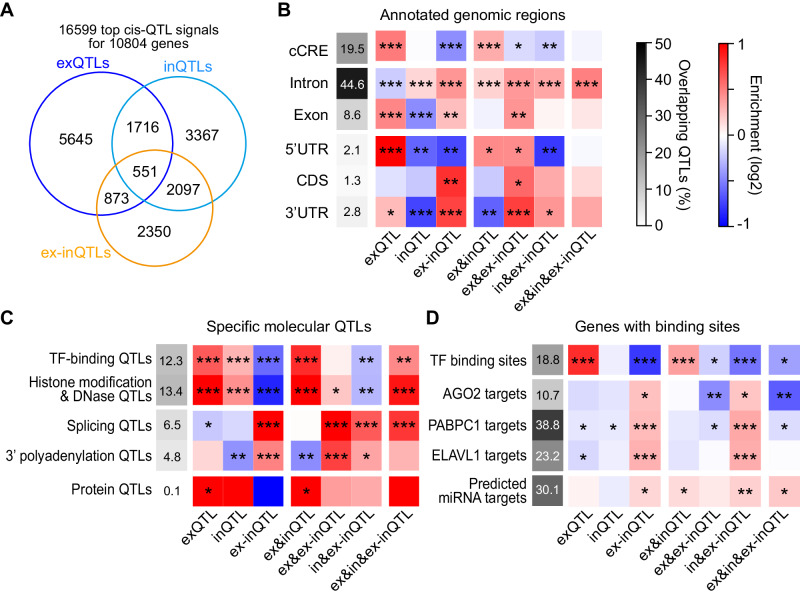
Fig. 2. Sharing between top cis-QTL signals, and location within specific genomic regions, overlap with other molecular QTLs, and with genes with certain binding sites.
A Venn diagram showing the sharing between different types of cis-QTLs. In total, 16,599 independent top cis-QTL signals for 10,804 genes were detected. B Enrichment within annotated genomic regions (represented as a blue-red heatmap) for different types of cis-QTLs and shared cis-QTLs relative to cis-QTLs not contained in or shared with that group of cis-QTLs. Asterisks indicate a significant enrichment (*, p < 0.05, **, p < 0.001, ***, p < 0.00001, two-sided Fisher’s exact test). The overall overlap for all cis-QTLs with different genomic regions is indicated in grayscale. cCRE: candidate cis-regulatory element, UTR: untranslated region, CDS: coding sequence. C Similar as B, but for enrichment in overlap with specific molecular QTLs identified for LCLs. D Similar as B, but for enrichment within genes harbouring certain binding sites determined in LCLs, considering top cis-QTLs located within genes.

