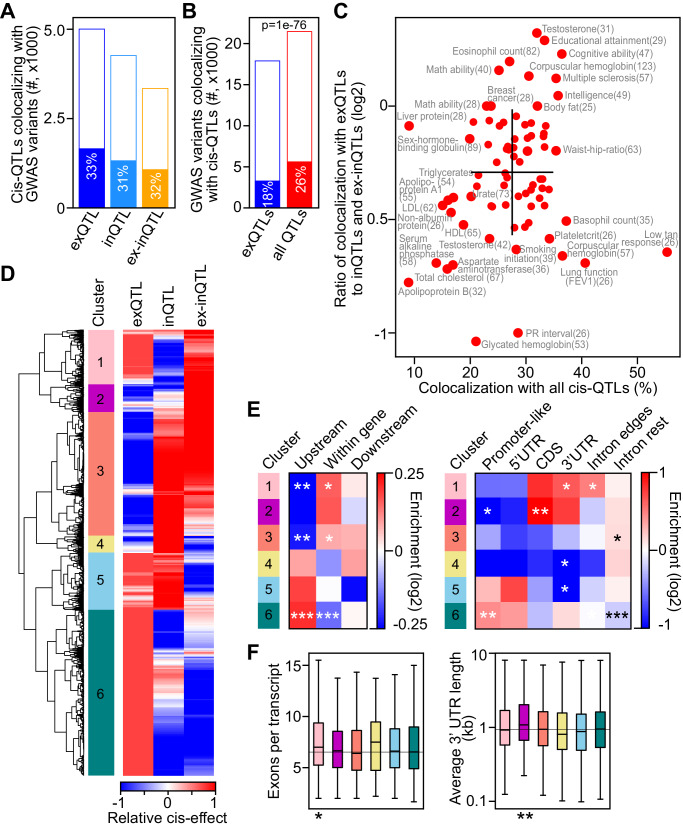
Fig. 4. Colocalization between GWAS variants and top cis-QTLs of different types.
A Number of top cis-QTLs colocalizing with GWAS variants (filled bars) of tested QTLs (full bars) for different QTL types. B Number of GWAS variants colocalizing with top cis-QTLs (filled bars) of tested GWAS variants (full bars) for colocalization with exQTL and all QTL types. P value was calculated using two-sided Fisher’s exact test. C Percentage of colocalizing GWAS variants (x-axis) and log2 ratio of GWAS variants colocalizing with exQTL to those colocalizing with inQTLs or ex-inQTLs (y-axis), for 78 GWAS traits with at least 25 colocalizations. GWAS traits with extreme values are labelled, and the number of colocalizing GWAS variants is indicated in parenthesis. Black lines indicate the mean ± standard deviation for each axis. D Clustering of normalised cis-QTL effects for 3237 QTLs colocalizing with GWAS trait variants and with measured effects for all types of QTL-associations. Six distinct clusters are labelled. E Enrichment of QTLs upstream, within or downstream of associated genes (left panel) and enrichment within annotated genomic regions (right panel) for cis-QTLs of each cluster compared to cis-QTLs of other clusters. Intron-edges include 100 bps at intron starts and ends. *, p < 0.05, **, p < 0.01, ***, p < 0.0001, calculated using two-sided Fisher’s exact test. F Average number of exons per annotated transcript (left panel) and average 3’ UTR length (right panel) of genes associated with top cis-QTLs in different clusters (indicated by colour code from D). Boxes indicate the interquartile range of the data (second and third quartile) with a line at the median. Whiskers extend to the farthest data point lying within 1.5× the interquartile range from the box. *, p = 0.011, **, p = 0.0014, calculated using two-sided Ranksum test compared to genes with cis-QTLs in other clusters. The number of genes included in each box are n = 290, 174, 671, 87, 297 and 962.

