

Abstract
In this work, a new concept for the approximate determination of the reaction enthalpy of the reaction between CO2 and monoethanolamine (MEA) in aqueous solution was developed. For this purpose, a CO2 gas stream was flowed into aqueous MEA solutions with different concentrations of 1 wt%, 2.5 wt% and 7.5 wt%. The weight difference ∆T, which is based on the increase in CO2 bound by the MEA over time, was documented using a thermographic camera. The mass difference ∆m, which is also based on the increase in CO2 bound by the MEA over time, was determined using a balance. By determining ∆T and ∆m, an approximate calculation of the reaction enthalpy is possible. The deviation from the values from the data known from the literature was less than 5% in all experiments.
Keywords: Thermography, Gravimetry, Reaction enthalpy, MEA, CO2 capturing
Subject terms: Analytical chemistry, Organic chemistry, Physical chemistry, Environmental sciences
Introduction
The amount of anthropogenic greenhouse gas emissions, especially the concentration of CO2, in the atmosphere is steadily increasing since the industrial revolution in the nineteenth century and there is no sign of this trend reversing1–3. The greenhouse gases the mankind emits has serious consequences for our planet, such as global warming. If the earth warms too much, it can negatively influence all life on earth3,4.
An important goal to the present and future generations should be to find solutions to reduce greenhouse gas emissions. The solution to this problem is not just to reduce the greenhouse gas emissions alone5. A very promising approach for CO2 capture and storage is gas scrubbing with an aqueous solution containing ethanolamine6–9. Gas scrubbing enables end-of-the-pipe technology, which means that existing industrial plants can be retrofitted with such technology and do not need to be replaced5,10,11. The absorption of acid gases in alkaline solutions is an already established industrial process for the treatment of gases1,12,13.
When CO2 is bound in an aqueous MEA solution, the CO2 is first dissolved in the water and then binds to the amine (cf. Eq. 1)1.
| 1 |
This chemical reaction releases energy in the shape of heat. It is known that the reaction enthalpy is approx. − 854 kJ mol-1.14,15.
In general, the calculation of the reaction enthalpy is described by the Eq. 216:
| 2 |
In Eq. 2, ∆U is the energy difference between the initial state and the final state of the system and p∆V is the volume work. The enthalpy change in a chemical reaction is expressed by the reaction enthalpy. The reaction enthalpy indicates whether a chemical reaction is endothermic or exothermic. If energy is released during the reaction, the reaction is exothermic; if energy is required, it is endothermic. For exothermic reactions, ∆HR < 0 (energy is released) and for endothermic reactions ∆HR > 0 (energy is absorbed by the system)16–18.
The reaction enthalpy plays an important role in the scale-up of chemical processes and in calculations related to process safety19. Until now, the reaction enthalpy of chemical reactions has been determined using calorimetry. There is direct and indirect calorimetry. In direct calorimetry, the heat quantities are determined using a calorimeter. Your calorimeter is an insulated apparatus in which the reaction can take place. The heat that is released or required for the reaction is measured. In indirect calorimetry, the amount of heat released is calculated indirectly via the measured substance consumption20,21.
Thermography is a process in which temperature changes can be measured. In this work, thermography was used to track chemical reactions. Chemical reactions are either endothermic or exothermic. In an endothermic reaction, energy is used so that a decrease in temperature can be observed. In an exothermic reaction, energy is released so that an increase in temperature can be observed. These temperature differences can be measured with a thermographic camera22.
This article describes a method for the approximate determination of the reaction enthalpy of chemical reactions in aqueous phase with a gas using the reaction of CO2 with MEA. In contrast to classical calorimetry, this new method does not require a closed system. It offers a quick and easy way to determine reaction enthalpies approximately without the use of a calorimeter. The reaction of MEA with CO2 in water was chosen because the enthalpy of reaction is already known in literature and is therefore suitable for evaluating the new method. The experiments were carried out with aqueous MEA solutions of different concentrations at room temperature.
Material and methods
Calculation method of the reaction enthalpy
The mass differences determined in the gravimetric experiments were used to calculate the molar quantity of CO2 bound in the MEA solution.
By definition, it takes 1 J to heat 1 g of water by 0.239 K23. This means that it is possible to deduce the energy released during the chemical reaction from the temperature differences determined by the thermographic camera.
By dividing the temperature difference determined in the thermographic experiments by 0.239 K g J−1, the energy released per g of solution during the reaction could be calculated (specific energy e [J g−1]). The aqueous MEA solution was assumed to have the same properties as water due to its dilution (cf. Eq. 3).
| 3 |
This value was then multiplied by the mass of solution used and divided by the molar quantity of gas absorbed, resulting the reaction enthalpy of the reaction (cf. Eq. 4).
| 4 |
Gravimetric experiments
The gravimetric experiments were carried out in a vessel measuring 20 × 10 × 6 cm with different MEA solutions (cf. Fig. 1). The mass of the solutions used for each experiment was 200 g. The solution was aerated with 40 l h−1 CO2 via a glass frit. Stirring was performed via a overhead stirrer with 250 rpm. A cling film was used as a splash guard, which had openings for inserting the frit and the overhead stirrer. The experimental setup was placed on a precision balance. The weight was recorded once per minute. Each experiment was conducted three times.
Figure 1.

Experimental setup of the gravimetric experiments.
Thermographic experiments
The thermographic experiments were carried out in a vessel measuring 20 × 10 × 6 cm with different MEA solutions (cf. Fig. 2). The mass of the solutions used for each experiment was 200 g. The solution was aerated with 40 l h-1 CO2 via a frit. The mixing was done via a magnetic stirrer with 250 rpm. A cling film was used as a splash guard, which had openings for inserting the frit. The thermographic camera (VarioCAM HD head 980 S by the company InfraTec) monitored the reaction vertically from the top. The magnetic stirrer and the camera were warm-up for 30 min so that no falsification of the data could take place through the electrics. The evaluation of the data was done by the software IRBS 3.1. Each experiment was conducted three times.
Figure 2.
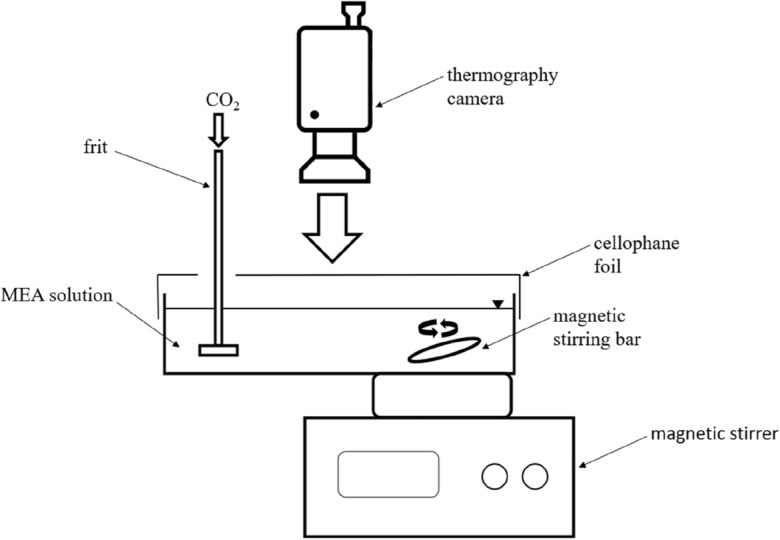
Experimental setup of the thermographic experiments.
Results and discussion
Results and discussion of the gravimetric experiments
The mass difference (∆m) was used in the evaluation of the gravimetric data, as the mass changing over time was measured in the gravimetric tests with the balance (Supplementary information 1).
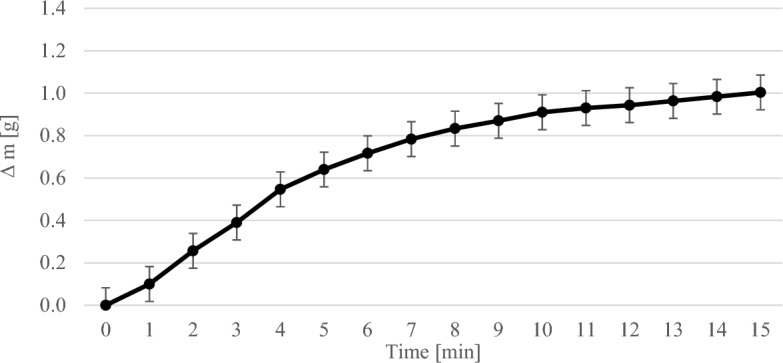
Figure 3 shows the course of the gravimetric experiments with 1 wt% MEA. The error bars show the standard deviation of the repetitions of the experiment. The increase in mass was plotted against time. After about 10 min the MEA solution became saturated.
Figure 3.

Results of the gravimetric experiments with 1 wt% MEA solution.
Figure 4 shows the course of the gravimetric experiments with 2.5 wt% MEA. The error bars show the standard deviation of the repetitions of the experiment. The weighted mass difference was plotted against time. As one can see that the maximum amount of CO2 which can be absorbed by the 2.5 wt% MEA solution was not yet reached after 15 min.
Figure 4.
Results of the gravimetric experiments with 2.5 wt% MEA solution.
Figure 5 shows the course of the gravimetric experiments with 7.5 wt% MEA. The error bars show the standard deviation of the repetitions of the experiment. The weighed mass difference was plotted against time. It can be seen that the MEA solution became saturated at around 80 min and the weight reached its maximum.
Figure 5.
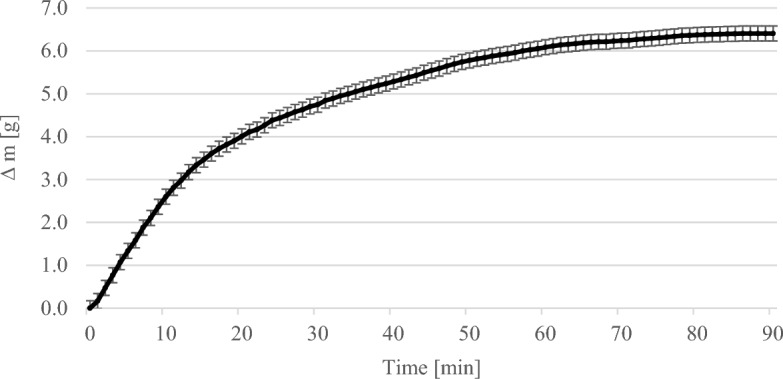
Results of the gravimetric experiments with 7.5 wt% MEA solution.
In general, the mass of the solution increased steadily as more and more CO2 was bound by the MEA solution over time until saturation occurred. The higher the concentration of MEA in the solution, the more CO2 could be bound. At a MEA concentration of 1 wt% it was 0.55 g per 200 ml solution, at 2.5 wt% 1 g per 200 ml solution and at 7.5 wt% 6.41 g per 200 ml solution. The more MEA there was in the solution, the longer it took for saturation to occur. At 1 wt% MEA the time was about 10 min and at 7.5 wt% about 80 min.
In order to assess these findings, gravimetric experiments were also carried out with water instead of the aqueous MEA solution. Here, no change in weight was observed over time.
Possible sources of error in the gravimetric experiments can be fluctuations in the gas volume flow, which exert pressure on the balance and thus falsify ∆m. Temperature fluctuations, which influence the rection of CO2 with MEA, could also be a source of error.
Results and discussion of the thermographic experiments
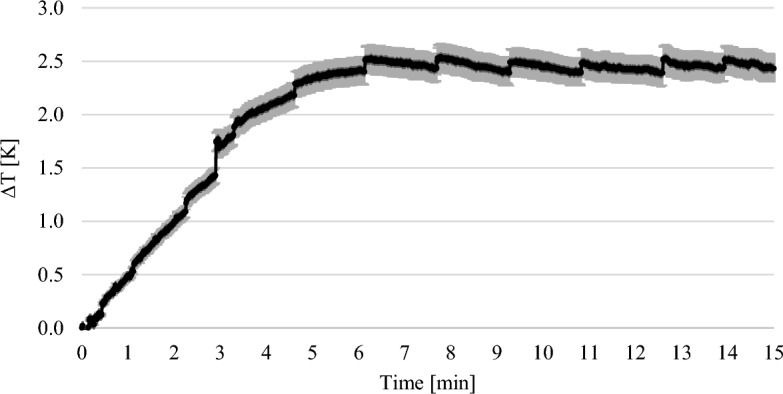
Figure 6 shows the course of the thermographic experiments with 1 wt% MEA. The error bars show the standard deviation of the repetitions of the experiment. The weighted temperature difference was plotted against time. This graph shows that the maximum temperature was not reached even after 15 min.
Figure 6.

Results of the thermographic experiments with 1 wt.% MEA solution.
Figure 7 shows the course of the thermographic experiments with 2.5 wt% MEA. The error bars show the standard deviation of the repetitions of the experiment. The weighted temperature difference was plotted against time. In contrast to the result at 1 wt% the maximum temperature was reached after approximately 6 min.
Figure 7.
Results of the thermographic experiments with 2.5 wt% MEA solution.
Figure 8 shows the course of the thermographic experiments with 7.5 wt% MEA. The error bars show the standard deviation of the repetitions of the experiment. The weighted temperature difference was plotted against time. The graph shows that the maximum temperature was reached after about 13 min. The temperature then dropped again.
Figure 8.
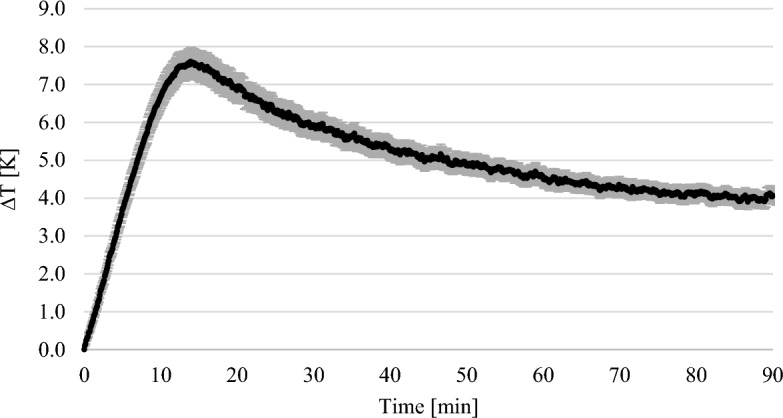
Results of the thermographic experiments with 7.5 wt% MEA solution.
The weight of the solutions increased steadily in the gravimetric experiments until a maximum was reached (see Figs. 3, 4, 5). In the thermographic experiments, the temperatures also increased initially until a maximum was reached. However, this maximum was always at an earlier point in time than in the gravimetric experiments. In the experiments with 7.5 wt% MEA solution, for example, the gravimetric maximum was reached after about 80 min (cf. Fig. 5), the temperature maximum after about 13 min (cf. Fig. 8). The temperature then dropped again. After 13 min, the reaction in the thermographic experiments continued in exactly the same way as in the gravimetric experiments, but obviously the reaction rate became less which leads to the drop of temperature.
In this work, thermographic experiments were also carried out with water instead of the aqueous MEA solution. No change in temperature was observed over time.
Possible sources of error in the thermographic experiments can be strong temperature fluctuations in the environment, which on the one hand influence the reaction of CO2 with MEA and, on the other hand, falsify the complete thermographic measurement (Supplementary information 1).
Results and discussion of the calculation of the reaction enthalpy
The temperature maxima from the thermographic experiments and the corresponding data from the gravimetric experiments at the same time were used to calculate the enthalpy (Supplementary information 1).
In the experiments with 1 wt% MEA, ∆T was used at a time of 15 min. At this time, ∆T was 1.34 K (cf. Fig. 6). The ∆m of the solution in the gravimetric tests was 0.55 g after 15 min (cf. Fig. 3). Thus, the calculated enthalpy was − 89.21 kJ mol−1 and deviates from the literature values by 4.46%14.
In the experiments with 2.5 wt% MEA, ∆T was used at the time of 13–15 min. ∆T at this time was 2.44 K (cf. Fig. 7). The ∆m of the solution in the gravimetric experiments was 1 g after 15 min (cf. Fig. 4). Thus, the calculated enthalpy was − 89.56 kJ mol-1 and deviats from the literature values by 4.87%14.
In the experiments with 7.5 wt% MEA, ∆T was used at the time of 14 min. ∆T at this time was 7.6 K (cf. Figure 8). The ∆m of the solution in the gravimetric experiments was 3.34 g after 14 min (cf. Figure 5). Thus, the calculated enthalpy was − 83.88 kJ mol-1 and deviates from the literature values by 1.78%14.
Overall, the deviation of the enthalpies determined according to the described method was less than 5% in all experiments14.
Possible sources of error in the calculation of the reaction enthalpy could be that the temperature maximum of the reaction is determined incorrectly and the wrong mass is used for the calculation at the wrong time.
Outlook and conclusion
Using the reaction of CO2 in an aqueous MEA solution as an example, a new concept for the approximate determination of the enthalpy of the reaction of a gas in an aqueous solution was successfully developed in this work. For this purpose, a CO2 gas flow of 40 L h−1 was fed into aqueous MEA solutions of various concentrations and ∆T was determined with the aid of a thermographic camera and ∆m with a balance. MEA solutions with a concentration of 1 wt%, 2.5 wt% and 7.5 wt% were used for this purpose. In the experiments with 1 wt% MEA, the enthalpy determined was − 89.21 kJ mol−1, in the experiments with 2.5 wt% MEA -89.56 kJ mol−1 and in the experiments with 7.5 wt% MEA − 83.88 kJ mol−1. The enthalpy stated in the literature is − 85.4 kJ mol−114. The deviation from the values in the literature was therefore less than 5% in all experiments. The reaction enthalpy plays an important role in the scale-up of chemical processes and in calculations related to process safety19. With the method developed in this work, it is possible to fast and simple determine the reaction enthalpy of reactions of gases in an aqueous solution.
Supplementary Information
Acknowledgements
We like to thank the reaching program of the faculty MLS, Furtwangen University, for support.
Author contributions
S.K. and I.B. performed the literature search. The manuscript was written by S.K. and I.B. The tables and images were produced by S.K. and I.B. The complete writing, design, and corrections of the manuscript were led and supervised by J.J. and M.S.S. All authors have read and agreed to the published version of the manuscript.
Funding
Open Access funding enabled and organized by Projekt DEAL.
Data availability
The datasets generated during and/or analyzed during the current study are available from the corresponding author on reasonable request.
Competing interests
The authors declare no competing interests.
Footnotes
Publisher's note
Springer Nature remains neutral with regard to jurisdictional claims in published maps and institutional affiliations.
Supplementary Information
The online version contains supplementary material available at 10.1038/s41598-024-61242-9.
References
- 1.Kammerer S, Borho I, Jung J, Schmidt MS. CO2 capturing methods of the last two decades. Int. J. Environ. Sci. Technol. 2023;20:8087. doi: 10.1007/s13762-022-04680-0. [DOI] [Google Scholar]
- 2.Nejat P, Jomehzadeh F, Taheri MM, Gohari M, Abd MZ, Majid A global review of energy consumption, CO2 emissions and policy in the residential sector (with an overview of the top ten CO2 emitting countries) Renew. Sustain. Energy Rev. 2015;43:843. doi: 10.1016/j.rser.2014.11.066. [DOI] [Google Scholar]
- 3.Nikendei C, Bugaj TJ, Nikendei F, Kühl SJ, Kühl M. Klimawandel: Ursachen, Folgen, Lösungsansätze und Implikationen für das Gesundheitswesen. Zeitschrift fur Evidenz, Fortbildung und Qualitat im Gesundheitswesen. 2020;156–157:59. doi: 10.1016/j.zefq.2020.07.008. [DOI] [PubMed] [Google Scholar]
- 4.Hertwich EG. Increased carbon footprint of materials production driven by rise in investments. Nat. Geosci. 2021;14:151. doi: 10.1038/s41561-021-00690-8. [DOI] [Google Scholar]
- 5.MacDowell N, Florin N, Buchard A, Hallett J, Galindo A, Jackson G, Adjiman CS, Williams CK, Shah N, Fennell P. An overview of CO 2 capture technologies. Energy Environ. Sci. 2010;3:1645. doi: 10.1039/c004106h. [DOI] [Google Scholar]
- 6.Lepaumier H, Picq D, Carrette P-L. New amines for CO2 capture. I. Mechanisms of amine degradation in the presence of CO2. Ind. Eng. Chem. Res. 2009;48:9061. doi: 10.1021/ie900472x. [DOI] [Google Scholar]
- 7.Lepaumier H, Martin S, Picq D, Delfort B, Carrette P-L. New amines for CO2 capture. III. effect of alkyl chain length between amine functions on polyamines degradation. Ind. Eng. Chem. Res. 2010;49:4553. doi: 10.1021/ie902006a. [DOI] [Google Scholar]
- 8.Lepaumier H, Picq D, Carrette P-L. New amines for CO2 capture. II. Oxidative degradation mechanisms. Ind. Eng. Chem. Res. 2009;48:9068. doi: 10.1021/ie9004749. [DOI] [Google Scholar]
- 9.Martin S, Lepaumier H, Picq D, Kittel J, de Bruin T, Faraj A, Carrette P-L. New amines for CO2 capture. IV. Degradation, corrosion, and quantitative structure property relationship model. Ind. Eng. Chem. Res. 2012;51:6283. doi: 10.1021/ie2029877. [DOI] [Google Scholar]
- 10.Bailey DW, Feron PH. Post-combustion decarbonisation processes. Oil Gas Sci. Technol. Rev. IFP. 2005;60:461. doi: 10.2516/ogst:2005028. [DOI] [Google Scholar]
- 11.Schwister, K., Leven, V. Verfahrenstechnik für Ingenieure. Lehr- und Übungsbuch, Hanser, München, (2020).
- 12.Daneshvar N, Zaafarani Moattar M, Abedinzadegan Abdi M, Aber S. Carbon dioxide equilibrium absorption in the multi-component systems of CO2+ TIPA+ MEA+ H2O, CO2+ TIPA+ Pz+ H2O and CO2+ TIPA+ H2O at low CO2 partial pressures: experimental solubility data, corrosion study and modeling with artificial neural network. Sep. Purif. Technol. 2004;37:135. doi: 10.1016/j.seppur.2003.09.004. [DOI] [Google Scholar]
- 13.Fischedick, M., Görner, K., Thomeczek, M. (Eds.) CO2: Abtrennung, Speicherung, Nutzung. Ganzheitliche Bewertung im Bereich von Energiewirtschaft und Industrie, Springer Vieweg, Berlin, Heidelberg, (2015).
- 14.Kohl, A. L., Nielsen, R. B. Gas purification, Gulf Publ. Co, Houston, Tex., (1997).
- 15.Pradere C, Hany C, Toutain J, Batsale J-C. Thermal analysis for velocity, kinetics, and enthalpy reaction measurements in microfluidic devices. Exp. Heat Transf. 2009;23:44. doi: 10.1080/08916150903402732. [DOI] [Google Scholar]
- 16.Mortimer, C. E., Müller, U. Chemie. Das Basiswissen der Chemie, Thieme, Stuttgart, (2019).
- 17.Atkins PW. Physikalische Chemie. VCH-Verl.-Ges; 1987. [Google Scholar]
- 18.Keszei, E. Chemical thermodynamics. An introduction, Springer, Berlin, Heidelberg, (2012).
- 19.Mleczko, L., Westermann T. in Springer Reference Naturwissenschaften (Ed.: W. Reschetilowski), Springer, Berlin, Heidelberg, pp. 1–41 (2019).
- 20.Sarge, S. M., Höhne, G. W. H., Hemminger, W. Calorimetry. Fundamentals, instrumentation and applications, Wiley-VCH Verlag, Weinheim, Germany, (2014).
- 21.Eder FX. Thermische und kalorische Stoffeigenschaften. Springer; 1983. [Google Scholar]
- 22.Taylor, S. J., Morken, J. P. Science (New York, N.Y.), 267–280 (1998). [DOI] [PubMed]
- 23.Physikalisch-Technische Bundesanstalt (PTB), "Die gesetzlichen Einheiten in Deutschland", can be found under https://www.google.com/url?sa=t&rct=j&q=&esrc=s&source=web&cd=&cad=rja&uact=8&ved=2ahUKEwiZmuL02cOCAxWLhv0HHeBMAskQFnoECBgQAQ&url=https%3A%2F%2Fwww.ptb.de%2Fcms%2Ffileadmin%2Finternet%2Fpresse_aktuelles%2Fbroschueren%2Fintern_einheitensystem%2FDie_gesetzlichen_Einheiten.pdf&usg=AOvVaw23K-Il25eW-bxXmOoe9-hl&opi=89978449, 2012.
Associated Data
This section collects any data citations, data availability statements, or supplementary materials included in this article.
Supplementary Materials
Data Availability Statement
The datasets generated during and/or analyzed during the current study are available from the corresponding author on reasonable request.