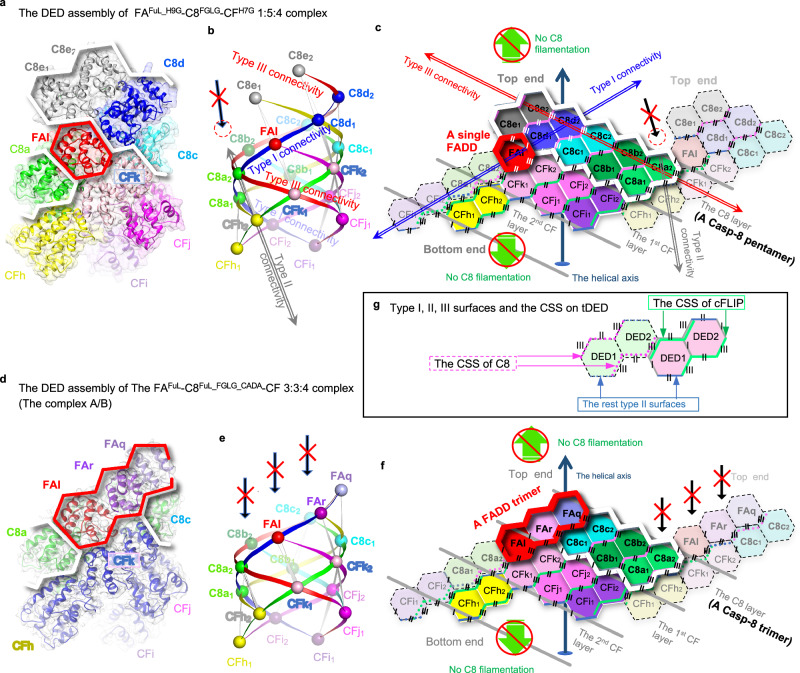
Fig. 2. FADD, Casp-8, and cFLIP assemble a single- and a triple-FADD complexes.
a–c The ribbon, ball-and-ribbon, and hexagon diagrams in a–c, respectively, depict the crystal structure of the single-FADD ternary complex. In a and c, the FADD and Casp-8 portions are highlighted by red and white thick lines, respectively. In b, the diagram shows the type I, II, and III connectivity by ribbons connecting every two adjacent DEDs, represented by balls (Supplementary Fig. 1c, “Methods” section). In b and c, a red dashed circle indicates the adjoining space of Casp-8 molecule C8e, while a long black arrow with a red X indicates the space was not filled by any DED. Each hexagon in the 2D representation represents a DED, with six sides representing the type I, II, and III surfaces. Each protein or tDED molecule is labeled with its chain ID and colored uniquely. CFk1, for example, stands for the DED1 of cFLIP (CF) with the chain ID k. The molecule with the same chain ID retains consistent coloring across all three diagrams to facilitate comparison and identification, except that Casp-8 and cFLIP are colored in green and blue, respectively, in d and Fig. 7b. The dashed hexagons, which adjoin the tDED with the solid lines, represent an adjacent tDED from a different layer. The angled and angled/dashed lines highlight the CSS of tDEDs with solid edges and dashed edges, respectively. Notably, cFLIP and Casp-8 CSS are colored in green and pink, respectively. Top and bottom ends, see Supplementary Fig. 13. d–f Similar to a–c, except that the diagrams d–f depict the cryo-EM structure of the triple-FADD ternary complex. Long black arrows with a red X indicate that FADD physically blocks Casp-8 filamentation on the top end. g Shows a type III interaction between cFLIPtDED and Casp-8tDED, colored in pink and green, respectively.

