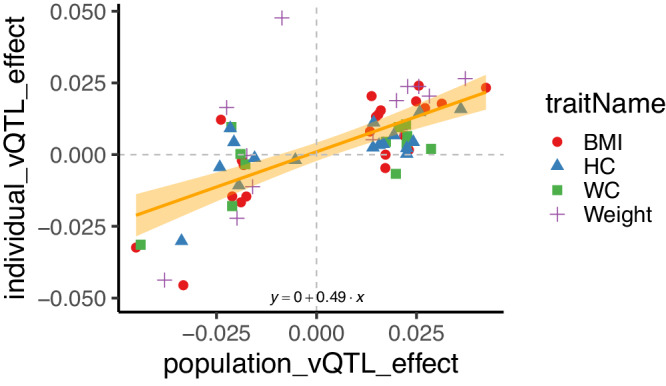
Fig. 5. Variance-controlling quantitative trait loci (vQTL) effects estimated either at the population level or using within-person variability.

Loci were ascertained for significant population-level effects (P < 1×10⁻⁸) for body mass index (BMI, red circle), hip circumference (HC, blue triangle), waist circumference (WC, green square) and weight (purple cross), and their effects re-estimated using within-individual variability. The estimated regression across all traits is shown with 95% CI ( = 0.49, s.e. = 0.07), and each trait is shown independently in Supplementary Fig. S3.
