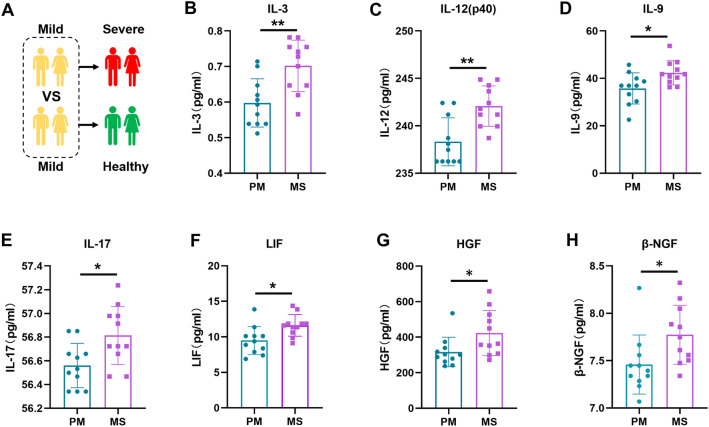
Figure 2.
Cytokine and chemokine analysis of patients in the PM and MS groups during the mild stage of COVID-19, (A) Schematic diagram illustrating patients in the PM and MS groups. (B–H) Differences in the expression of IL-3, IL-12 (p40), IL-9, IL-17, LIF, HGF, and β-NGF between patients in the PM and MS groups during the initial mild phase of COVID-19. The p value was calculated using unpaired two-sided Student’s t tests. *P < 0.05, **P < 0.01.

