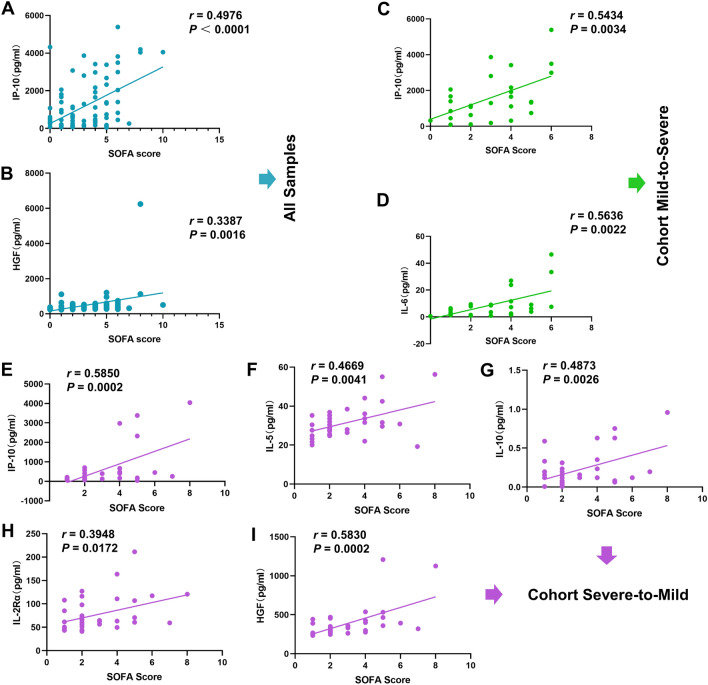
Figure 6.
Correlation analysis of cytokines and chemokines with clinical SOFA scores. (A–B) Correlations between plasma levels of IP-10 and HGF and SOFA scores in all 84 samples from 44 patients. The Pearson correlation coefficient was used to determine the correlation’s r value between any two groups. (C,D) Correlations between plasma levels of IP-10 and IL-6 and SOFA scores in patients who experienced mild-to-severe transition. The data were analysed using the Pearson correlation coefficient. (E–I) Correlations between plasma levels of IP-10, IL-5, IL-10, IL-2Rα, and HGF and SOFA scores in severe-to-mild COVID-19 patients. The Pearson correlation coefficient was used in the analysis.

