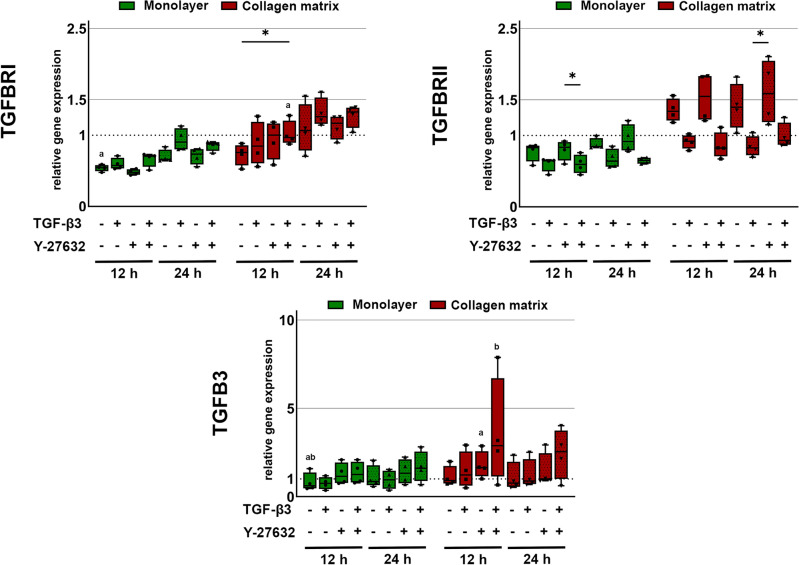
Figure 3.
Gene expression of TGFB3 and its receptors. Cells cultured as monolayer or on collagen matrix were incubated with 10 ng/ml TGF-β3 and/or 10 µM Y-27632 for 12 h and 24 h. Box plots represent the median values and error bars the minimum to maximum interval. Asterisks mark differences between the stimulation groups with p < 0.05. Letters mark differences with p < 0.05 between collagen matrix and monolayer within same stimulation groups or in comparison to monolayer control (n = 4).

