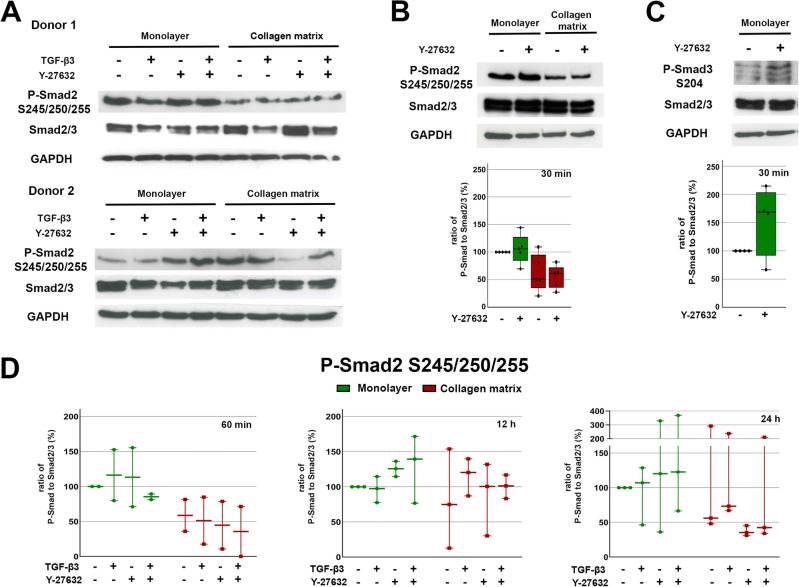
Figure 5.
Western blot results of Smad2/3 linker phosphorylation. Cells cultured as monolayer or on collagen matrix were incubated with 10 ng/ml TGF-β3 and/or 10 μM Y-27632. Representative Western blot result of linker phosphorylation at Ser245/250/255 of Smad2 after 24 h (A) and 30 min (B) stimulation and at Ser204 of Smad3 after 30 min stimulation (C). Quantitative analysis of linker phosphorylation at Ser245/250/255 (B: n = 5; D: n = 3) and Ser204 (C, n = 4). Box plots represent the ratio of P-Smad to Smad2/3 and dots the values of the different donors.

