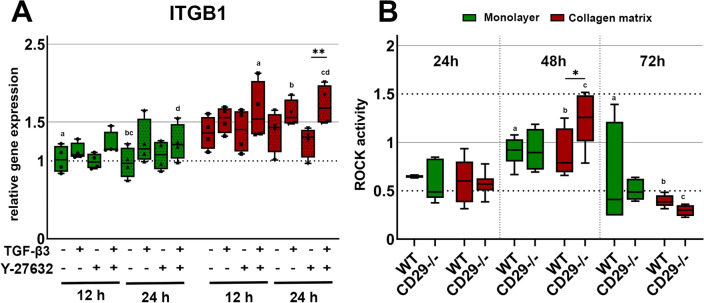
Figure 6.
Gene expression of ITGB1 (A) and ROCK activity assay (B). (A) Cells cultured as monolayer or on collagen matrix were incubated with 10 ng/ml TGF-β3 and/ or 10 μM Y-27632. Box plots represent the relative gene expression of ITGB1. Asterisks mark differences between the stimulation groups with p < 0.05. Letters mark differences with p < 0.05 between collagen matrix and monolayer within same stimulation groups or in comparison to monolayer control (n = 4). (B) wild type (WT) and CD29−/− cells were cultured as monolayer or on collagen matrix and analyzed after 24, 48 and 72 h. Box plots represents the ROCK activity. Asterisks mark differences between the WT and CD29−/− with p < 0.05 and letters differences between the different timepoints sharing the same letter with p < 0.05 (n = 3).

