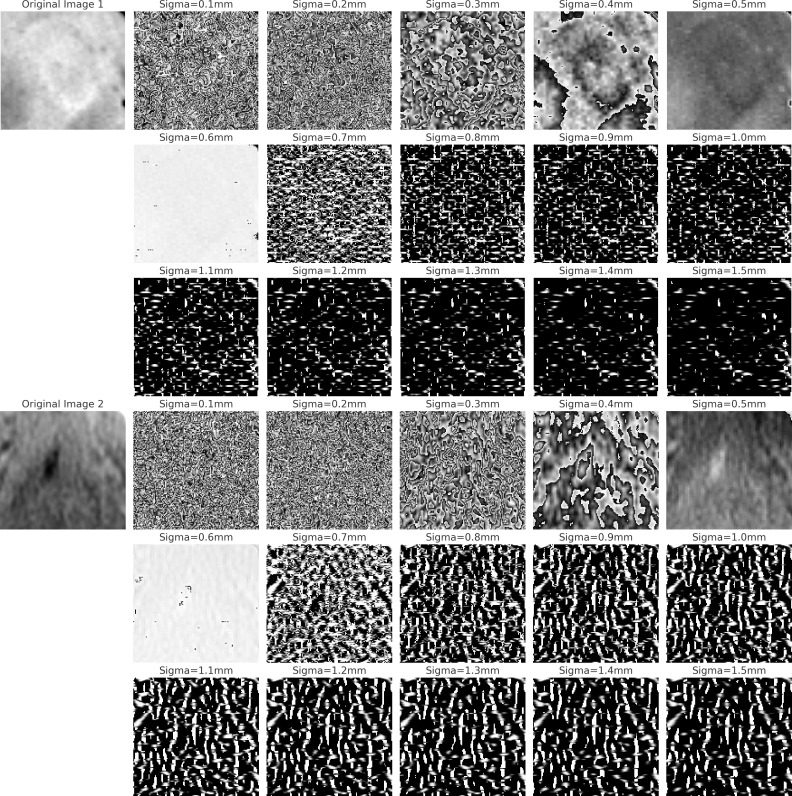
Figure 11.
The figure displays two sets of LoG filtered images. The first three rows show OSCC images in the tongue region at varying sigma values, illustrating changes in the primary ROI. The last three rows depict normal tissue in the same region, also filtered at corresponding sigma values, to highlight contrasts between OSCC and normal textures.

