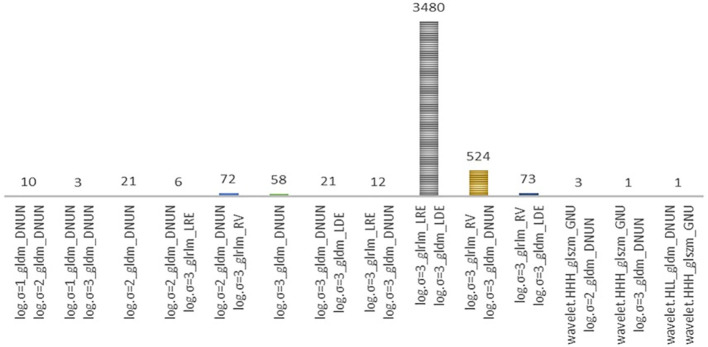
Figure 4.
This frequency bar plot visualizes the counts of various degree-2 logistic models derived from the best-subset of eight radiomics features previously identified. These models were generated through 5000 iterations of data shuffling. Distribution of models during the selection of the final optimal set of risk radiomics features. These models comprise the risk radiomics features selected by the Best Subset Logistic Regression procedure from among the 8 RFE-selected features. Out of 5000 different partitions, 3480 models are based on two features, log.sigma.3.0.mm.3D_glrlm_LongRunEmphasis and log.sigma.3.0.mm.3D_gldm_LargeDependenceEmphasis.

