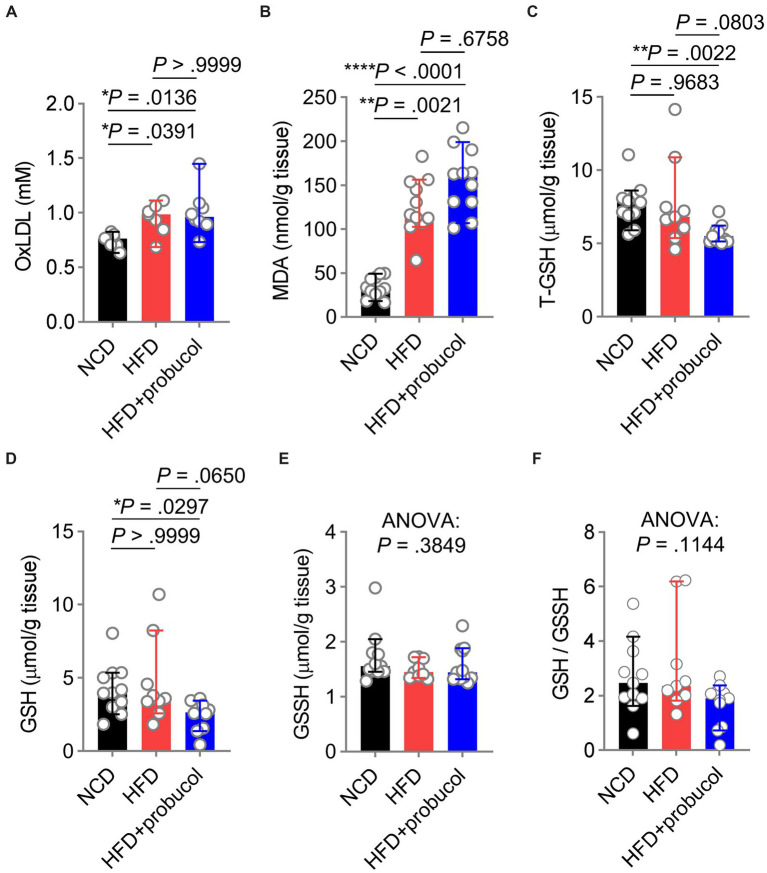
Figure 4.
Influences of probucol feeding on mice redox status. (A,B) The levels of oxLDL (A) and MDA (B) in mice. Data are presented as individual values with median ± 95% CI (n = 7 or 8 mice per group for oxLDL, n = 11 mice per group for MDA). OxLDL, Kruskal-Wallis test (p = 0.0080), followed by Dunn’s multiple comparisons test. MDA, Kruskal-Wallis test (p < 0.0001), followed by Dunn’s multiple comparisons test. (C–F) The levels of T-GSH (C), GSH (D), GSSH (E), and the GSH:GSSH ratio (F) in mice. Data are presented as individual values with median ± 95% CI (n = 9 or 11 mice for each group). T-GSH, Kruskal-Wallis test (p = 0.0026), followed by Dunn’s multiple comparisons test. GSH, Kruskal-Wallis test (p = 0.0171), followed by Dunn’s multiple comparisons test. GSSH, Kruskal-Wallis test (p = 0.3849). GSH/GSSH, Kruskal-Wallis test (p = 0.1144). p < 0.05 was indicative of statistical significance.

