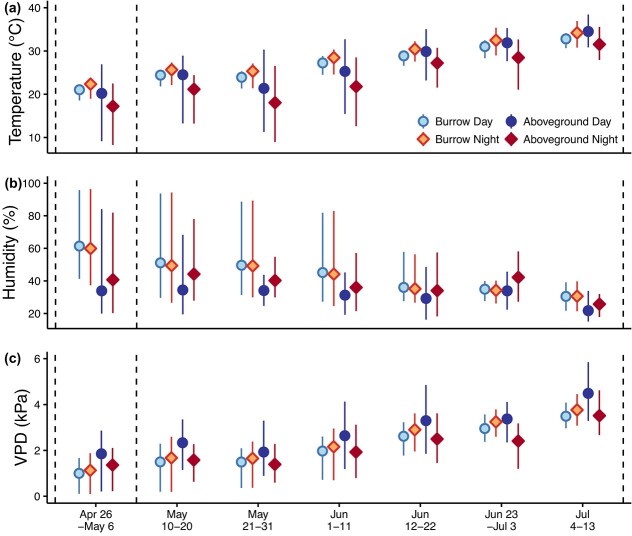
Figure 7.
Burrow microhabitat versus local aboveground climate where G. sila were studied. Temperature (a) and relative humidity (b) were recorded by a local weather station near the study site and by data loggers placed 1 m into burrows at the study site. VapoVPD (c) was calculated based on temperature and relative humidity values (Eq 1–3; Campbell and Norman, 1998). Points represent average daily mean values ± minimum and maximum daily mean for each time interval. Vertical dashed lines show when hydric physiology measurements were taken. Burrow temperatures were warmer at night than during the day, as expected based on well-described time lags in the thermal diel cycle deep below ground (Telemeco et al., 2016).

