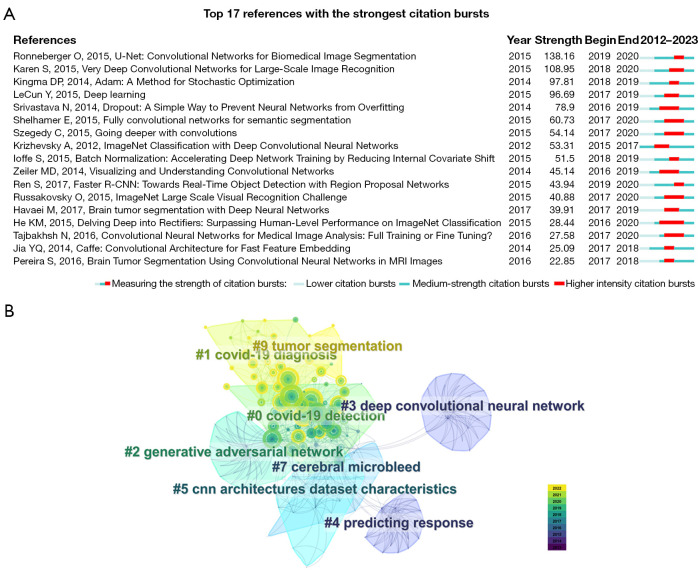
Figure 6.
Visualization of the reference data analysis. (A) Top 17 references with the strongest citation bursts; light blue, blue, and red indicate low, medium, and high citation burst intensity, respectively (15,37-41,43,46,48,49,53-59). (B) Reference cluster display, different colors distinguish among cluster topics; circles indicate the research time of the included subtopics.

