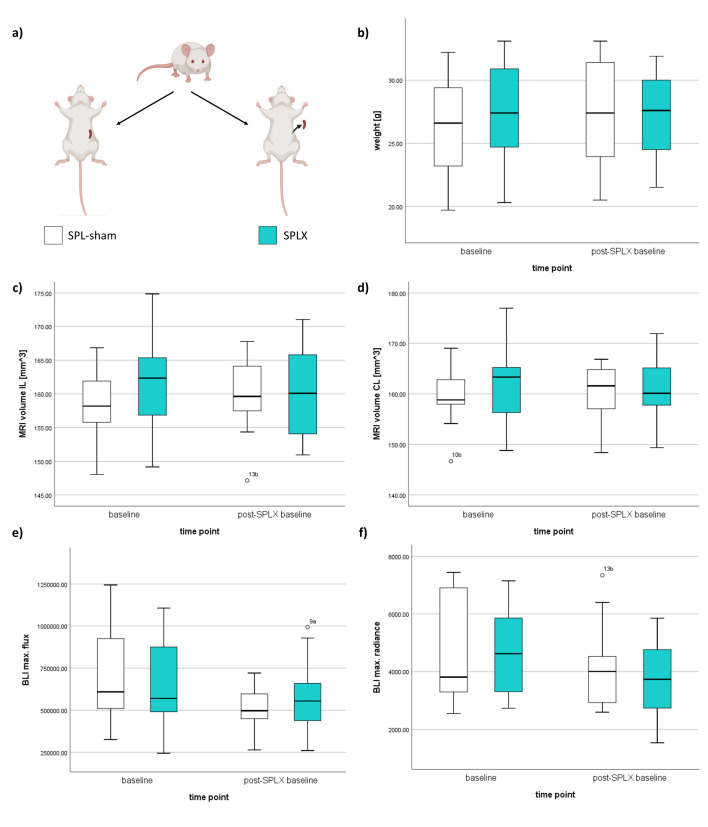
Figure 2.
Baseline characteristics of the experimental groups. (A) Mice distribution into groups before experimental procedures: splenectomized mice group (SPLX) – gray; sham-operated group (SPL-sham) – white. (B) Mean body weight values of mice. (C) Mean values of ipsilateral hemisphere (IL) volume at baseline. (D) Mean values of the contralateral hemisphere (CL) volume at baseline. (E) Mean values of maximum bioluminescence (BLI) increase at baseline. (F) Mean values of maximum BLI radiation at baseline.

