Fig. 2.
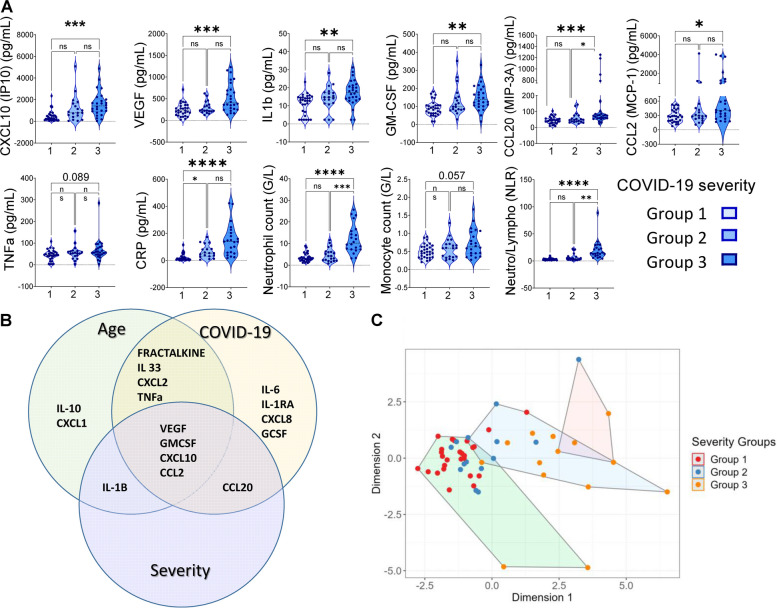
Myelo-senescence parameters positively associated with COVID-19 severity. A) CXCL10 (IP-10), VEGF, IL-1b, GM-CSF, MIP-3a, CCL2 (MCP-1), TNFa concentrations (pg/mL), CRP, neutrophil and monocyte counts and Neutrophil to Lymphocyte Ratio (NLR) were compared between severity groups. Two-group differences were tested using a two-sided unpaired t-test. The difference was considered as significant when the p value was equal to or under 0.05. The p value are summarized with asterisks (< 0.05*, < 0.01**, < 0.001***, < 0.0001****). B) Venn diagram showing the cytokines positively associated with: (i) COVID-19 (COVID-19+ versus COVID-19−), (ii) age in COVID-19+ patients (older versus younger cohort) and (iii) COVID-19 severity in older people. CXCL10, VEGF, GM-CSF, and CCL2 (MCP-1) are positively associated with age, COVID-19 and severity (results from Venny 2.1.). C) A clustering model (K-means) integrating the relevant senescence variable in a principal component analysis defined 3 clusters. Each point represents an individual for whom we have all the data for the variables listed (CXCL10, VEGF, IL-1B, GM-CSF, CCL2, CRP, neutrophils, monocytes, lymphocytes, NLR). The critical group 3 patients are mainly in the same clusters (red and blue) that is different from the green cluster in which non-severe non-critical patients are dominant

