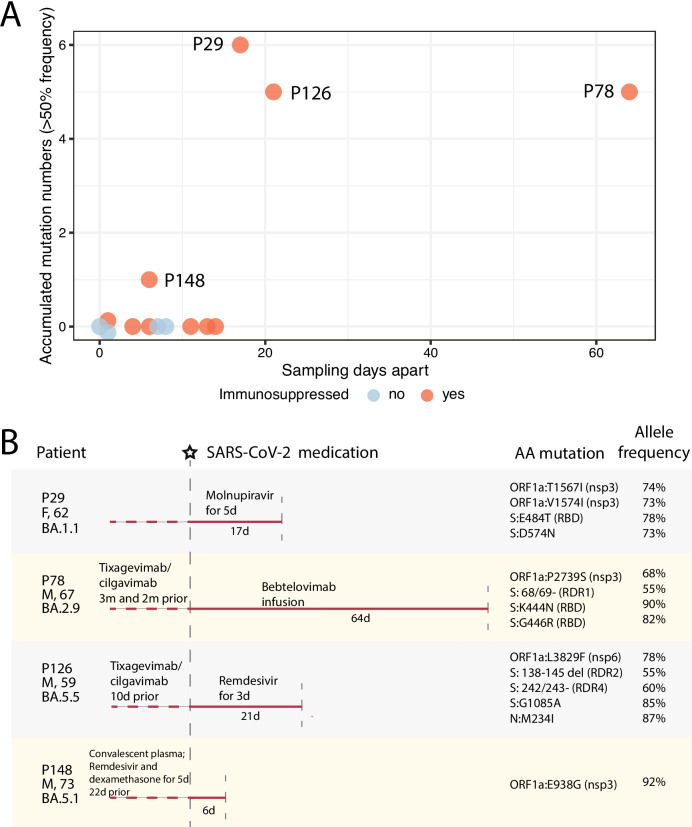
Fig. 3.
Accumulation of mutations in patients over time, as revealed by serial sampling and sequencing. A The number of accumulated nucleotide mutations detected in 14 repeatedly sampled patients. Orange dots represent immunosuppressed patients, and blue dots represent non-immunosuppressed patients. The y-axis shows the number of patients’ mutations changed between two samplings, and the x-axis shows sampling intervals (days). B Schematic diagram of SARS-CoV-2 treatment history and viral mutation accumulation in five immunosuppressed patients. Patient ID, gender, age, and infected viral sublineages are shown on the left side. The vertical dashed gray lines represent the 1st (starred) and 2nd sampling events, with days apart annotated under the line. Medication before and after the 1st sampling event is shown above the line. Amino acid mutations accumulated between two sampling events and their allele frequencies are shown on the right

