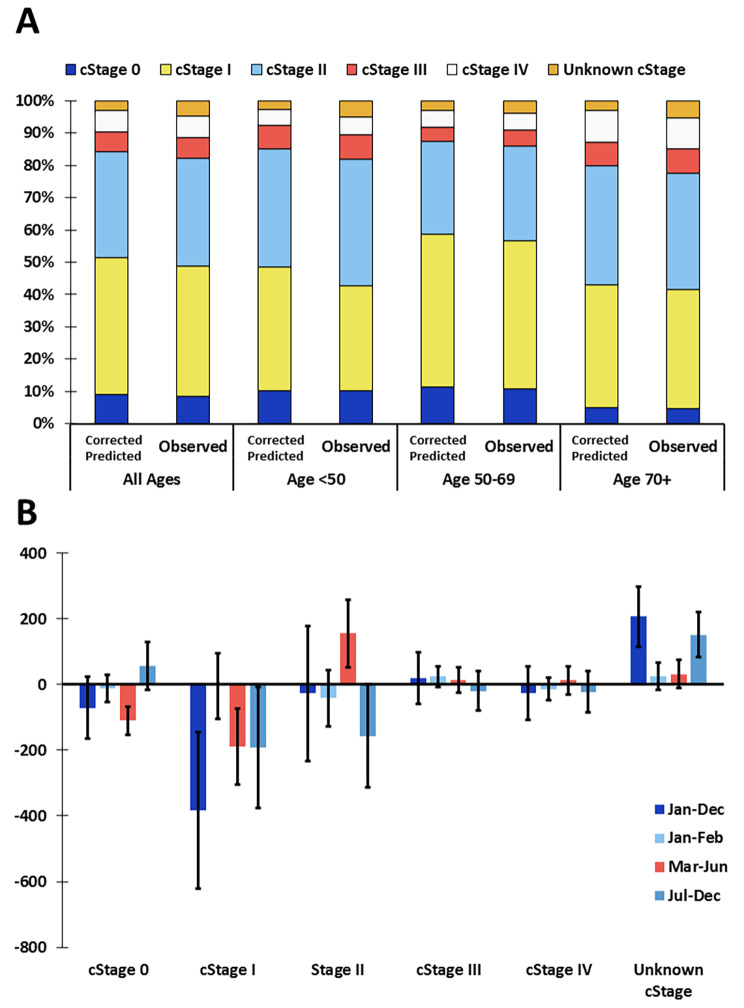
Fig. 2.
More pronounced decline in diagnosis in lower stage breast cancers. (A) Predicted (corrected for total decline in diagnoses) and observed clinical stage distributions in 2020 per age group indicating the percentage of cases (invasive or in situ) per stage. (B) Difference between the number of observed cases and the corrected-predicted number of cases of invasive or in situ breast cancer in 2020 by clinical stage and by month of incidence. Error bars represent 95% confidence intervals. When the 95% confidence interval does not contain 0, the observed number of cases is significantly different from what would be predicted if the numbers in all stages declined (or increased) proportional to the total decline (or increase) in cases relative to the reference period

