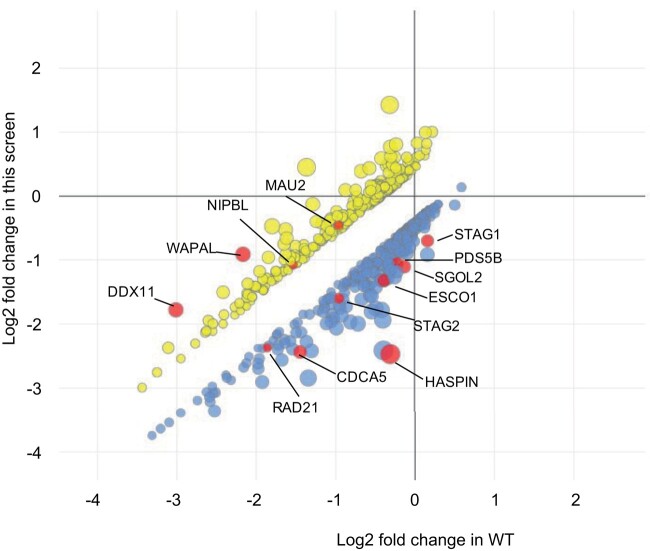
Fig. 3.
DDX11 negative and positive GIs. A scatterplot illustrating the fitness effect (LFC) of 642 genes in DDX11 KO versus WT parental HAP1 cell line, which exhibited a significant GI (|qGI| > 0.4, FDR < 0.2). A total of 324 negative (blue, lower cluster) and 320 positive (yellow, upper cluster) DDX11 GIs are shown. Node size corresponds to a combined score reflecting both the qGI and the FDR. Selected genes belonging to the cohesin complex or affecting sister chromatid cohesion are highlighted in red (and labelled with lines and gene names).

